
Quick Answer
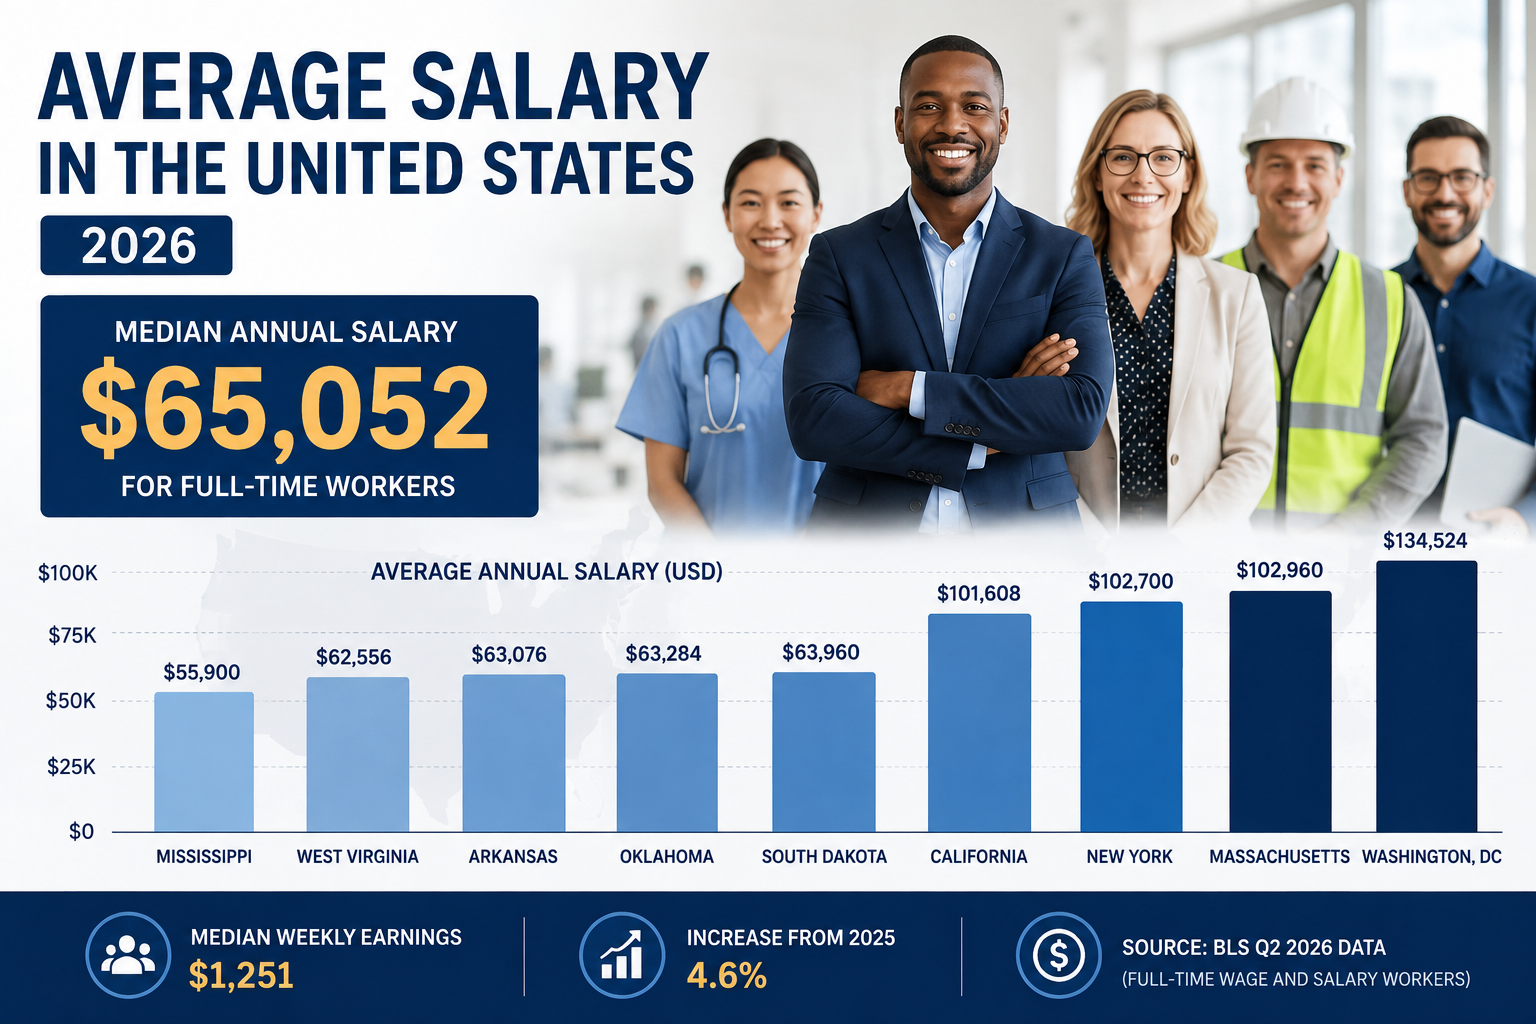
The median annual salary for full-time workers in the United States is $65,052 as of the second quarter of 2026. That breaks down to $1,251 per week, $5,421 per month, or approximately $31.28 per hour for a 40-hour work week. Wage growth of 4.6% over the past year continues to outpace inflation (3.9%), meaning real purchasing power for American workers is slowly increasing.
Key Statistics at a Glance
| Metric | Value |
|---|---|
| Median Weekly Earnings (Q2 2026) | $1,251 |
| Median Annual Salary | $65,052 |
| Median Monthly Salary | $5,421 |
| Median Hourly Wage (40-hour week) | $31.28 |
| Year-over-Year Wage Growth | 4.6% |
| Inflation Rate (CPI-U) | 3.9% |
| Total Full-Time Workers | 120.9 million |
| Men’s Median Weekly Earnings | $1,380 |
| Women’s Median Weekly Earnings | $1,131 |
Data Source: U.S. Bureau of Labor Statistics, Current Population Survey, Q2 2026.
Average vs. Median: Why the Numbers Differ
If you’ve seen different salary numbers in different places, there’s a good reason.
The average (mean) salary—sometimes reported as $69,846—is calculated by adding every worker’s income and dividing by the number of workers. The problem? Extremely high earners pull this number upward. A handful of CEOs and hedge fund managers can make the “average” American look wealthier than they actually are.
The median salary is the precise midpoint of all incomes. Half of workers earn more, half earn less. The median is not distorted by outliers.
Editorial Analysis: For a typical professional evaluating their own earnings, the median of $65,052 is the more accurate benchmark. The average is useful for understanding the overall economy, but the median tells you what your actual peers are earning.
Salary Growth Since 2020: Where We’ve Been
Understanding how salaries have changed in recent years provides critical context for the 2026 numbers. The pandemic, inflation, and a tight labor market have all shaped wage growth.
| Year | Median Weekly Earnings | Annual Equivalent | Year-over-Year Change |
|---|---|---|---|
| 2020 (Q2) | $1,008 | $52,416 | — |
| 2021 (Q2) | $996 | $51,792 | -1.2% |
| 2022 (Q2) | $1,048 | $54,496 | +5.2% |
| 2023 (Q2) | $1,108 | $57,616 | +5.7% |
| 2024 (Q2) | $1,151 | $59,852 | +3.9% |
| 2025 (Q2) | $1,196 | $62,192 | +3.9% |
| 2026 (Q2) | $1,251 | $65,052 | +4.6% |
Career Insight: Wages stagnated briefly during the pandemic, then accelerated sharply in 2022 and 2023 as employers competed for talent. Growth has since stabilized but remains healthy. Workers who switched jobs during this period typically saw larger increases than those who stayed in place.
Salary by State: Complete Table
State-level data reveals dramatic differences in pay across the country. The table below shows average weekly wages for all covered workers, including part-time and salaried employees, as of Q4 2025 (the most recent complete state data available from the BLS). Estimated median salaries are editorial calculations based on the average-to-median relationship in national data.
| Rank | State | Avg Weekly Wage | Avg Annual Wage | Est. Median Salary |
|---|---|---|---|---|
| 1 | Washington, D.C. | $2,587 | $134,524 | ~$110,000 |
| 2 | Massachusetts | $1,980 | $102,960 | ~$85,000 |
| 3 | New York | $1,975 | $102,700 | ~$82,000 |
| 4 | California | $1,954 | $101,608 | ~$80,000 |
| 5 | Washington | $1,948 | $101,296 | ~$82,000 |
| 6 | Connecticut | $1,801 | $93,652 | ~$77,000 |
| 7 | New Jersey | $1,691 | $87,932 | ~$72,000 |
| 8 | Colorado | $1,683 | $87,516 | ~$72,000 |
| 9 | New Hampshire | $1,652 | $85,904 | ~$70,000 |
| 10 | Maryland | $1,616 | $84,032 | ~$70,000 |
| 11 | Illinois | $1,588 | $82,576 | ~$68,000 |
| 12 | Virginia | $1,585 | $82,420 | ~$68,000 |
| 13 | Texas | $1,549 | $80,548 | ~$66,000 |
| 14 | Minnesota | $1,505 | $78,260 | ~$65,000 |
| 15 | Delaware | $1,502 | $78,104 | ~$64,000 |
| 16 | Alaska | $1,497 | $77,844 | ~$64,000 |
| 17 | Florida | $1,471 | $76,492 | ~$63,000 |
| 18 | Pennsylvania | $1,470 | $76,440 | ~$63,000 |
| 19 | Oregon | $1,468 | $76,336 | ~$63,000 |
| 20 | Arizona | $1,446 | $75,192 | ~$62,000 |
| 21 | Georgia | $1,440 | $74,880 | ~$62,000 |
| 22 | Rhode Island | $1,429 | $74,308 | ~$61,000 |
| 23 | Michigan | $1,427 | $74,204 | ~$61,000 |
| 24 | Tennessee | $1,424 | $74,048 | ~$61,000 |
| 25 | Hawaii | $1,411 | $73,372 | ~$60,000 |
| 26 | North Carolina | $1,409 | $73,268 | ~$60,000 |
| 27 | Nevada | $1,395 | $72,540 | ~$60,000 |
| 28 | Utah | $1,389 | $72,228 | ~$59,000 |
| 29 | Vermont | $1,378 | $71,656 | ~$59,000 |
| 30 | Ohio | $1,358 | $70,616 | ~$58,000 |
| 31 | North Dakota | $1,350 | $70,200 | ~$58,000 |
| 32 | Wisconsin | $1,346 | $69,992 | ~$58,000 |
| 33 | Maine | $1,332 | $69,264 | ~$57,000 |
| 34 | Missouri | $1,324 | $68,848 | ~$57,000 |
| 35 | Idaho | $1,303 | $67,756 | ~$56,000 |
| 36 | Alabama | $1,301 | $67,652 | ~$56,000 |
| 37 | Wyoming | $1,297 | $67,444 | ~$55,000 |
| 38 | Montana | $1,296 | $67,392 | ~$55,000 |
| 39 | Iowa | $1,282 | $66,664 | ~$55,000 |
| 40 | Indiana | $1,276 | $66,352 | ~$55,000 |
| 41 | South Carolina | $1,276 | $66,352 | ~$55,000 |
| 42 | Nebraska | $1,275 | $66,300 | ~$55,000 |
| 43 | New Mexico | $1,275 | $66,300 | ~$55,000 |
| 44 | Kansas | $1,268 | $65,936 | ~$54,000 |
| 45 | Louisiana | $1,267 | $65,884 | ~$54,000 |
| 46 | Kentucky | $1,235 | $64,220 | ~$53,000 |
| 47 | South Dakota | $1,230 | $63,960 | ~$52,000 |
| 48 | Oklahoma | $1,217 | $63,284 | ~$52,000 |
| 49 | Arkansas | $1,213 | $63,076 | ~$51,000 |
| 50 | West Virginia | $1,203 | $62,556 | ~$50,000 |
| 51 | Mississippi | $1,075 | $55,900 | ~$46,000 |
Note: Estimated median salaries are editorial approximations and not direct BLS figures.
Highest Paying States (Average Wages)
- Washington, D.C. – $134,524/year
- Massachusetts – $102,960/year
- New York – $102,700/year
- California – $101,608/year
- Washington – $101,296/year
Lowest Paying States (Average Wages)
- Mississippi – $55,900/year
- West Virginia – $62,556/year
- Arkansas – $63,076/year
- Oklahoma – $63,284/year
- South Dakota – $63,960/year
Editorial Analysis: The gap between the highest (DC) and lowest (Mississippi) average annual wages is an astonishing $78,624. However, this doesn’t tell the full story. The cost of living in high-wage states like New York and California is significantly higher than in Mississippi. A $100,000 salary in New York City has roughly the same purchasing power as $52,000 in Jackson, Mississippi. Always evaluate job offers in terms of real purchasing power, not nominal dollars.
Salary by Age: When Your Earnings Peak
Age remains one of the strongest predictors of income. The following table shows median weekly earnings for full-time workers in Q2 2026.
| Age Group | Median Weekly Earnings | Annual Equivalent | Women’s Earnings as % of Men’s |
|---|---|---|---|
| 16-24 | $806 | $41,912 | 91.1% |
| 25-34 | $1,160 | $60,320 | 89.2% |
| 35-44 | $1,436 | $74,672 | 78.3% |
| 45-54 | $1,421 | $73,892 | 78.4% |
| 55+ | $1,335 | $69,420 | 78.5% |
Career Insight: Earnings accelerate rapidly between age 25 and 44, peaking in the mid-40s. For most professionals, the 10 years between 25 and 35 are the most critical for establishing a career trajectory. If your earnings are flat during this period, it’s worth evaluating whether your current employer or industry offers sufficient growth potential.
Salary by Education: The ROI of Degrees
Education credentials continue to deliver significant earnings premiums.
| Education Level | Median Weekly Earnings | Annual Equivalent | Premium Over HS Grad |
|---|---|---|---|
| Less than High School | $803 | $41,756 | -$9,932 |
| High School Diploma | $994 | $51,688 | $0 |
| Some College / Associate | $1,125 | $58,500 | +$6,812 |
| Bachelor’s Degree | $1,628 | $84,656 | +$32,968 |
| Advanced Degree | $1,963 | $102,076 | +$50,388 |
Editorial Analysis: A bachelor’s degree commands a premium of nearly $33,000 annually over a high school diploma—a substantial return on investment. Advanced degrees add another $17,000 on top of that. However, these premiums vary dramatically by field. A degree in engineering or computer science typically yields a higher ROI than a degree in liberal arts or education.
Salary by Gender: The Gap Persists
Despite progress, significant earnings disparities remain between men and women, and across racial and ethnic groups.
| Demographic | Median Weekly Earnings | Annual Equivalent | Ratio to White Men |
|---|---|---|---|
| White Men | $1,400 | $72,800 | 100% |
| White Women | $1,142 | $59,384 | 81.6% |
| Black Men | $1,089 | $56,628 | 77.8% |
| Black Women | $991 | $51,532 | 70.8% |
| Asian Men | $1,902 | $98,904 | 135.9% |
| Asian Women | $1,489 | $77,428 | 106.4% |
| Hispanic Men | $1,080 | $56,160 | 77.1% |
| Hispanic Women | $902 | $46,904 | 64.4% |
Career Insight: The gap between White men and Hispanic women is particularly stark—White men earn 55% more on average. Among younger workers (16-24), the gap is narrower, suggesting generational improvement. However, the gap widens as workers age, reflecting the compounding effects of career interruptions, industry segregation, and negotiation disparities.
Salary by Occupation: Which Fields Pay the Most?
Your industry and specific occupation remain the most significant determinants of your earnings.
| Occupational Group | Median Weekly Earnings (Men) | Median Weekly Earnings (Women) | Gap |
|---|---|---|---|
| Management, Professional | $1,928 | $1,476 | 23.4% |
| Sales and Office | $1,214 | $943 | 22.3% |
| Natural Resources, Construction | $1,120 | $812 | 27.5% |
| Production, Transportation | $1,022 | $829 | 18.9% |
| Service Occupations | $920 | $730 | 20.7% |
Top 10 Highest Paying Occupations (2026 Estimates)
| Occupation | Median Annual Salary |
|---|---|
| Anesthesiologists | > $250,000 |
| Cardiologists | > $250,000 |
| Surgeons | > $250,000 |
| Psychiatrists | ~$220,000 |
| Chief Executives | ~$210,000 |
| Nurse Anesthetists (CRNA) | ~$210,000 |
| Software Engineers (Senior) | ~$185,000 |
| Management Consultants | ~$165,000 |
| Data Scientists | ~$155,000 |
| Financial Managers | ~$150,000 |
Editorial Analysis: The highest-paying occupations cluster in healthcare, technology, and finance. These fields reward specialized knowledge, licensing, or advanced technical skills. For professionals considering a career pivot, these are the sectors with both high earning potential and sustained demand.
For detailed compensation information, see our guides on Software Engineer Salary, Registered Nurse Salary, CRNA Salary, Data Analyst Salary, and Management Consultant Salary.
Salary by Industry: Where the Money Flows
Beyond specific occupations, the industry you work in heavily influences your pay.
| Industry | Median Weekly Earnings | Annual Equivalent |
|---|---|---|
| Finance & Insurance | $1,650+ | $85,800+ |
| Information Technology | $1,600+ | $83,200+ |
| Professional Services | $1,500+ | $78,000+ |
| Healthcare | $1,350+ | $70,200+ |
| Manufacturing | $1,200+ | $62,400+ |
| Construction | $1,100+ | $57,200+ |
| Government | $1,050+ | $54,600+ |
| Retail Trade | $850+ | $44,200+ |
| Accommodation & Food | $650+ | $33,800+ |
Career Insight: Finance, technology, and professional services pay significantly above the national average. Retail and hospitality pay significantly below. For workers in lower-paying industries, gaining specialized skills or credentials is often the most effective path to higher earnings. For more information on finance careers, see our Accountant Salary guide.
Salary Percentile Distribution
Understanding where you fall in the income distribution provides important context for career decisions.
| Percentile | Weekly Earnings | Annual Equivalent |
|---|---|---|
| Bottom 10% | < $642 | < $33,384 |
| Bottom 25% | < $850 | < $44,200 |
| Median (50%) | $1,251 | $65,052 |
| Top 25% | > $1,915 | > $99,580 |
| Top 10% | > $2,924 | > $152,048 |
Editorial Analysis: Earning $100,000 per year places you above the 75th percentile—roughly the top 25% of full-time workers. Earning $150,000 places you in the top 10%. These thresholds vary by state, but they provide a useful national benchmark.
Is $50k, $75k, or $100k a Good Salary?
Whether a salary is “good” depends heavily on where you live and your household circumstances.
| Salary | National Ranking | Purchasing Power in NYC | Purchasing Power in Mississippi |
|---|---|---|---|
| $50,000 | Bottom 40% | Struggling | Comfortable |
| $65,052 (Median) | Average | Tight | Comfortable |
| $75,000 | Above Average | Tight | Very Comfortable |
| $100,000 | Top 20-25% | Comfortable | Excellent |
| $150,000 | Top 10% | Good | Excellent |
Career Insight: A $75,000 salary in New York City may feel similar to a $45,000 salary in rural Alabama. Always evaluate job offers using a cost of living calculator that accounts for housing, taxes, and goods.
Cost of Living Adjustment: Real Earnings by State
The table below adjusts average salaries for cost of living to show real purchasing power.
| State | Avg Annual Salary | Cost of Living Index (U.S.=100) | Real Adjusted Salary |
|---|---|---|---|
| Mississippi | $55,900 | 86.4 | $64,700 |
| Arkansas | $63,076 | 88.2 | $71,500 |
| Texas | $80,548 | 92.8 | $86,800 |
| Illinois | $82,576 | 95.6 | $86,400 |
| U.S. Average | ~$75,000 | 100 | ~$75,000 |
| Colorado | $87,516 | 109.7 | $79,800 |
| Massachusetts | $102,960 | 125.1 | $82,300 |
| California | $101,608 | 138.5 | $73,400 |
| New York | $102,700 | 139.1 | $73,800 |
Editorial Analysis: When adjusted for cost of living, some “lower paying” states offer greater real purchasing power than “higher paying” states. Texas and Illinois offer solid real earnings due to moderate costs. California and New York salaries, while nominally high, lose significant purchasing power to housing costs.
How to Increase Your Salary: 5 Evidence-Based Strategies
Based on the data above, here are the most effective ways to increase your earnings.
1. Switch Jobs Strategically
Workers who change employers typically see larger raises than those who stay. The gap is often 5-10% in a single move.
2. Invest in High-ROI Credentials
Not all education is equal. Degrees in technology, healthcare, and finance consistently offer the best returns. Advanced degrees in these fields can add $20,000-$50,000 annually.
3. Relocate to Higher-Paying States—Carefully
Moving from Mississippi to Massachusetts could increase your nominal salary by $47,000. But factor in housing costs before making the leap.
4. Negotiate
Research consistently shows that workers who negotiate their starting salary earn more over their career. The gap compounds over time.
5. Build Skills in High-Demand Fields
Technology, healthcare, and data analytics continue to show strong demand. Even for non-technical roles, proficiency in AI tools, data analysis, or business intelligence commands a premium. For technology careers, see our Product Designer Salary guide.
The 2026 Outlook: Where Are Salaries Headed?
Several factors will shape salary growth over the next 3-5 years.
- Technology Integration: AI and automation will reshape many roles. Professionals who can work alongside AI tools will command higher pay.
- Demographic Shifts: As baby boomers retire, demand for healthcare and skilled trades will intensify.
- Remote Work: Geographic pay differentials are compressing. Some companies are adjusting salaries for remote workers, while others are maintaining location-based pay.
- Labor Shortages: Skilled workers in healthcare, technology, and construction will continue to have negotiating leverage.
Career Insight: The outlook for wage growth is positive, but it won’t be uniform. Healthcare, technology, and skilled trades will see above-average growth. Retail, hospitality, and some manufacturing roles will see slower growth or contraction.
Methodology
The data in this article is sourced from the U.S. Bureau of Labor Statistics (BLS) Current Population Survey, a monthly survey of approximately 60,000 households conducted by the U.S. Census Bureau. The earnings data is collected from one-quarter of the CPS monthly sample and is limited to wage and salary workers. All self-employed workers, both incorporated and unincorporated, are excluded.
Key definitions:
- Usual weekly earnings: Earnings before taxes and deductions, including overtime pay, commissions, or tips. Weekly values are converted from other reporting periods.
- Full-time workers: Individuals who usually work 35 hours or more per week at their principal job.
- Median: The midpoint of the earnings distribution. Half of workers earn above the median, half below.
- Average (mean): The sum of all earnings divided by the number of workers.
State-level data: Average weekly wages by state are sourced from the BLS Quarterly Census of Employment and Wages (QCEW) for Q4 2025. These figures represent all covered workers (including part-time) and may differ from median full-time worker figures.
Estimated values: Where estimated median salaries are provided for states, these are editorial calculations based on the relationship between average and median earnings at the national level. They should be considered approximations.
For more information on how to calculate your take-home pay, use our Income Tax Calculator or CTC Calculator .
References
- U.S. Bureau of Labor Statistics – Current Population Survey
- U.S. Bureau of Labor Statistics – Quarterly Census of Employment and Wages
- U.S. Bureau of Labor Statistics – Usual Weekly Earnings News Release, Q2 2026
- Social Security Administration – National Average Wage Index
FAQs
What percentage of Americans make $75,000 a year?
Approximately 28.8% of individual workers earn $75,000 or more annually. This includes 12% who earn between $75,000 and $99,999 and 16.7% who earn between $100,000 and $149,999.
What is a good salary in the USA?
A “good” salary depends on location. Nationally, anything above the median of $65,052 is above average. In high-cost cities like New York or San Francisco, $100,000 may be necessary for a comfortable lifestyle. In low-cost states like Mississippi, $65,000 provides solid purchasing power.
What is a good salary for a 30-year-old?
The median weekly earnings for workers aged 25-34 is $1,160 ($60,320/year). A 30-year-old earning above this threshold is doing well compared to their peers. For context, earnings typically peak in the 45-54 age bracket at about $74,620.
Is $100,000 a year a good salary in the US?
Yes. A $100,000 salary places you in the top 20-25% of individual earners. However, its purchasing power varies significantly by state. In Mississippi, it’s an excellent salary; in New York City, it’s comfortable but not wealthy.
Is $50,000 a good salary in the US?
$50,000 is below the national median of $65,052. In low-cost states, it can provide a comfortable lifestyle. In high-cost states, it’s likely a struggle for a single person and very difficult for a family.
What is the average salary in the US per month?
The median monthly salary is $5,421, based on median weekly earnings of $1,251.
What is the average salary in the US per hour?
The median hourly wage is approximately $31.28, based on a 40-hour work week.
Which state has the highest average salary?
Massachusetts has the highest average annual salary at $102,960, followed closely by New York ($102,700) and California ($101,608). Washington, D.C. is highest overall at $134,524.
Which state has the lowest average salary?
Mississippi has the lowest average annual salary at $55,900, followed by West Virginia ($62,556) and Arkansas ($63,076).
What is the average salary in the US by age?
Earnings are lowest for 16-24 year olds ($41,912/year), peak for 45-54 year olds ($74,620/year), then decline for those 55 and older ($70,096/year). Full data is in the table above.
How much do the top 10% of Americans make?
The top 10% of full-time workers earn $152,048 or more annually (weekly earnings of $2,924+).
What is the average salary in the US in 2026?
The median annual salary is $65,052. The average (mean) is approximately $69,847.