
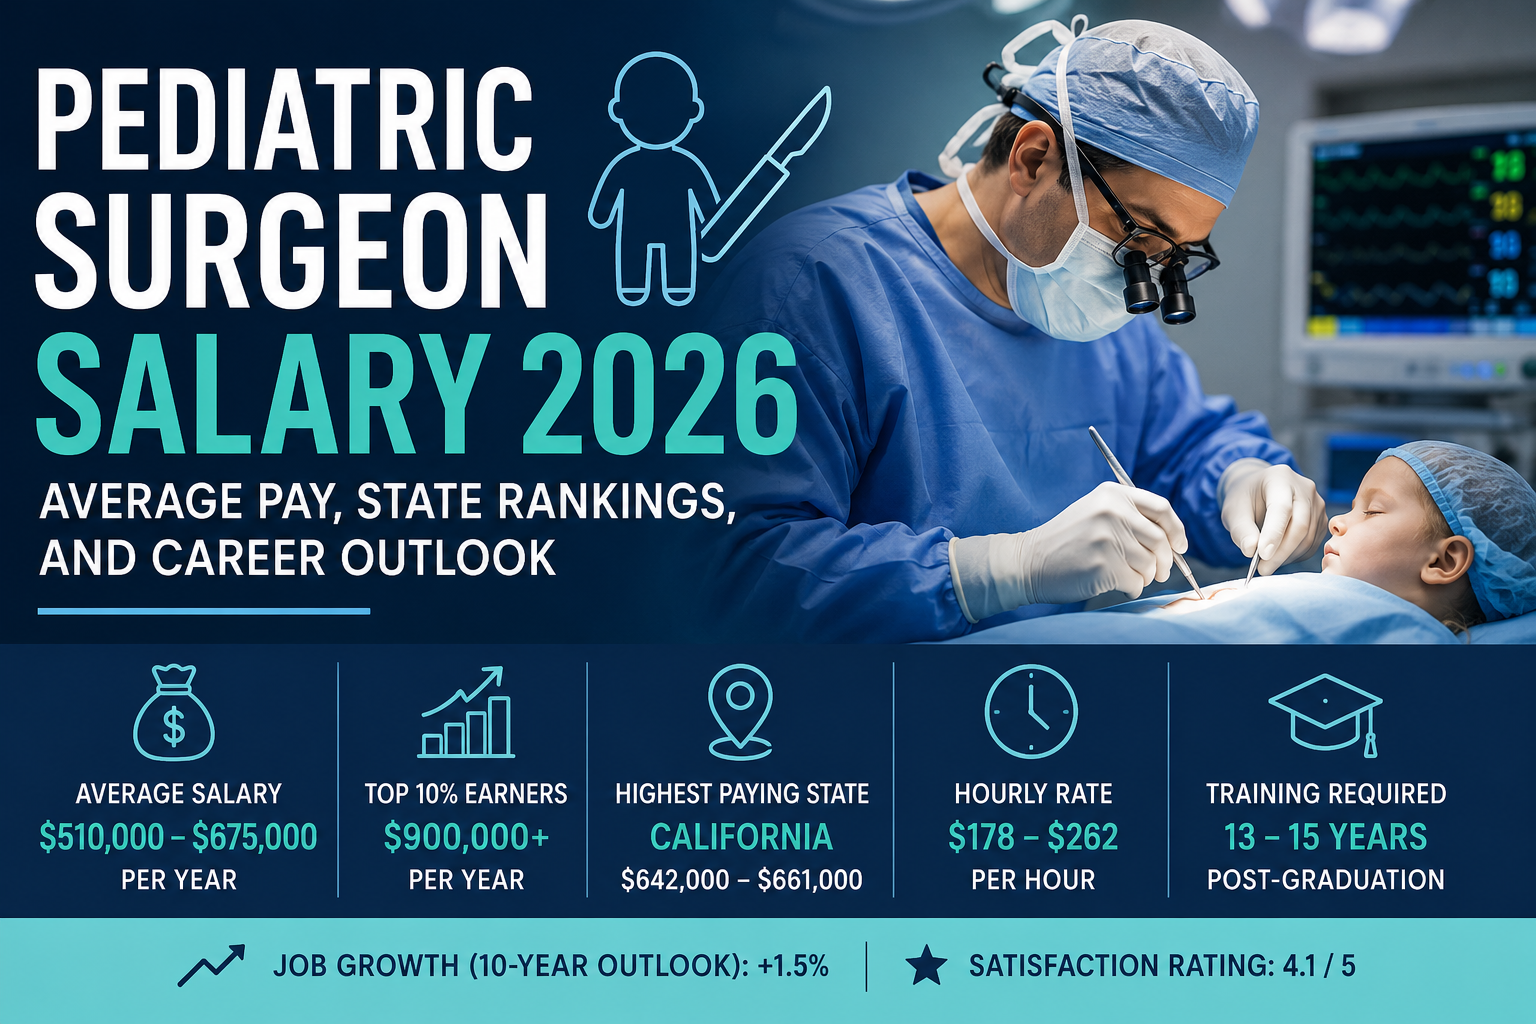
Quick Facts: Pediatric Surgeon Compensation
| Metric | Value |
|---|---|
| Average Salary | ~$510,000–$675,000 |
| Federal Median | ~$559,000 |
| Top 10% Earners | ~$900,000+ |
| Hourly Rate | ~$178–$262 |
| Monthly Salary | ~$42,500–$56,250 |
| Training Required | 13–15 years |
| Job Growth (10-year) | +1.5% |
| Satisfaction Rating | ⭐ 4.1/5 |
What Is a Pediatric Surgeon Salary in 2026?
Here’s what the compensation data actually tells us.
A pediatric surgeon in the United States earns between approximately $510,000 and $675,000 annually in 2026, with total compensation (including bonuses and incentives) pushing past $700,000 for top performers. Federal labor statistics report a median of approximately $559,000, while physician compensation surveys consistently show higher figures around $675,000 when including bonuses and performance incentives.
This places pediatric surgery in the top 5% of all U.S. occupations. However, relative to other surgical specialties, pediatric surgery sits in the upper-middle tier—below neurosurgery and orthopedics, but well above general surgery and most non-surgical specialties.
The number varies wildly by location, experience, practice setting, and—here’s the part nobody talks about—how well you negotiate.
Why Salary Estimates Differ—And What That Means for You
The spread between the lowest and highest credible estimates is over $200,000. That’s not a data problem. That’s a reality problem. Pediatric surgeon compensation genuinely varies that much.
The Four Reasons Numbers Don’t Match
1. Government Wage Data
Federal labor statistics track employer-reported wages. These numbers tend to be more conservative—around $449,000–$559,000—because they capture base wages before bonuses and incentives. The government’s 2023 estimate showed a mean annual wage of $449,320 for pediatric surgeons, with a high relative standard error of 30.6%. That variability suggests the data should be interpreted with caution.
2. Employer Payroll Databases
Large compensation databases pull from employer-submitted payroll data. These sources show numbers in the $510,000–$640,000 range, depending on geography. They track total cash compensation, including base salary plus reported bonuses. This is generally more accurate than government data for understanding actual market rates.
3. Physician Compensation Surveys
Self-reported physician surveys—where doctors anonymously share their earnings—consistently show the highest numbers, often $675,000–$700,000. Why? Selection bias. Doctors with higher-than-average salaries are more likely to share them. The quiet ones? They’re often the ones making less. These surveys also capture total compensation, including bonuses that may not appear in employer payroll data.
4. Private Practice Income
Some pediatric surgeons in private practice earn considerably more—or sometimes less—than employed physicians. Private practice income is notoriously difficult to track because it depends on case volume, payer mix, and practice overhead. This income is often excluded from traditional employment surveys, further widening the gap.
What This Means for You
Don’t anchor on any single number. Think in ranges. The “right” number depends on your experience, location, practice setting, and negotiation ability.
Pediatric Surgeon Salary by State
Location is the single biggest variable after experience. Here’s what the data shows for 2026.
Highest-Paying States
| State | Average Salary Range | Key Drivers |
|---|---|---|
| California | ~$642,000–$661,000 | High cost of living, major pediatric centers |
| New York | ~$648,000–$658,000 | Concentration of academic medical centers |
| Arizona | ~$534,000 | Growing pediatric population, competitive market |
| Texas | ~$476,000–$550,000 | No state income tax, major metro areas |
| Florida | ~$490,000–$566,000 | Large retiree and family population |
California leads the pack, with some communities showing averages around $642,000–$661,000. But don’t get too excited—California’s cost of living and tax burden eat into that premium aggressively. The top marginal state tax rate is 13.3%.
New York shows similar patterns, with some areas averaging $648,000–$658,000. Again, New York taxes and real estate are a different animal entirely.
Texas looks more modest at roughly $476,000–$550,000 on average—but that’s after accounting for no state income tax. The effective take-home difference between $550,000 in Texas and $650,000 in California is smaller than you think.
Florida sits in the middle, with averages around $490,000–$566,000. No state income tax makes Florida attractive.
The contrarian view: Don’t chase the highest nominal number. Run the net-after-tax-and-cost-of-living calculation. That $650,000 in California might net you less than $550,000 in Texas.
States with Highest Employment
| State | Employment Level |
|---|---|
| New York | ~100 |
| Michigan | ~80 |
| Illinois | ~40 |
| California | ~40 |
| Arizona | ~30 |
New York and Michigan have the highest concentrations of pediatric surgeons relative to their populations. This means more job opportunities—but also more competition.
Salary by Experience Level
Experience compounds. Hard.
| Experience Level | Typical Salary Range |
|---|---|
| Entry-level (0-3 years) | ~$310,000–$416,000 |
| Mid-career (4-7 years) | ~$461,000–$510,000 |
| Senior (8+ years) | ~$549,000–$758,000 |
| Top performers (90th percentile) | ~$900,000+ |
Entry-level pediatric surgeons (1-3 years) earn around $310,000–$416,000 depending on location. The national 10th percentile sits at roughly $417,000.
Mid-career pediatric surgeons clear $461,000–$510,000 as they build case volume and referral networks.
Senior pediatric surgeons (8+ years) earn $549,000–$758,000 nationally, with the 75th percentile hitting approximately $584,000.
The 90th percentile pushes past $900,000 in high-productivity practices.
The pattern: Expect a ~75% increase from entry-level to senior. That’s not automatic—it requires productivity, case volume, and strategic career moves.
Salary by Practice Setting
Hospital-employed physicians dominate the landscape—about 80% of pediatric surgeons work in hospital-employed settings. In these roles, base salary accounts for roughly 86% of total compensation (around $601,000), with the rest coming from bonuses, profit sharing, and incentives.
Academic vs. non-academic shows a surprising pattern. Recent physician compensation surveys indicate academic pediatric surgeons average roughly $727,000, while non-academic roles average around $615,000. That’s an approximate $112,000 premium for academia—counterintuitive to the conventional wisdom that academia pays less.
Why? Academic medical centers often bundle teaching stipends, research funding, and clinical revenue into total compensation. Plus, they compete aggressively for top talent.
Private practice data is harder to pin down—fewer pediatric surgeons go private, and those who do often have highly variable income structures. Some earn significantly more than employed physicians; others earn less after covering overhead.
Hourly and Monthly Breakdown
Hourly Rate: The Math That Matters
The average pediatric surgeon works ~55–62 hours per week.
| Annual Salary | Weekly Hours | Hourly Rate |
|---|---|---|
| ~$510,000 | 55 | ~$178 |
| ~$675,000 | 62 | ~$209 |
| ~$750,000 | 55 | ~$262 |
The hourly rate range: ~$178–$262 per hour, depending on total compensation and hours worked.
For context, federal data shows a mean hourly wage of roughly $216 as of 2023. That’s in the middle of our range.
The reality check: These are not 9-to-5 jobs. Call schedules, overnight shifts, and weekend emergencies are baked into the compensation. The per-hour rate matters more than the per-year number when you’re comparing against other specialties.
Monthly Salary
Monthly breakdown (pre-tax):
| Annual Salary | Monthly |
|---|---|
| ~$510,000 | ~$42,500 |
| ~$675,000 | ~$56,250 |
| ~$750,000 | ~$62,500 |
After taxes (assuming roughly 37% effective federal + state):
| Annual Salary | Net Annual | Net Monthly |
|---|---|---|
| ~$675,000 | ~$425,000 | ~$35,400 |
That’s the number that actually hits your bank account.
Training Requirements: The 15-Year Gauntlet
Here’s what it takes—and why the salary is justified.
| Stage | Duration |
|---|---|
| Undergraduate degree | 4 years |
| Medical school | 4 years |
| General surgery residency | 5 years |
| Pediatric surgery fellowship | 2 years |
| Total | ~15 years post-high school |
Some sources cite 13-15 years. The consensus: minimum 13 years, typically 15.
The brutal part: Pediatric surgery fellowship is one of the most competitive fellowships in medicine. Only a fraction of general surgery residents match into pediatric surgery programs each year. This exclusivity drives both the difficulty and the compensation.
The emotional part: You’re operating on children. The stakes are different. The outcomes hit differently. The training doesn’t just test your technical skills—it tests your psychological resilience.
Is It Hard to Be a Pediatric Surgeon?
Unequivocally, yes.
The difficulty isn’t just about the training duration—it’s about:
- The competition: Pediatric surgery fellowship match rates are among the lowest in medicine
- The hours: 55-62 hour weeks are average—many work more
- The emotional toll: Operating on children, delivering bad news to parents, managing complex congenital conditions
- The on-call demands: 1:2 or 1:3 call schedules are common
- The administrative burden: Documentation, prior authorizations, compliance—the non-clinical work keeps growing
The reward: Approximately 67% of pediatric surgeons say they would choose this specialty again. Satisfaction rating: 4.1 out of 5. That’s rare in medicine.
Career Outlook and Growth Potential
Salary Growth Projection
- Industry compensation analysts project 13-14% salary growth for pediatric surgeons over the next 5 years
- That translates to roughly $725,000–$735,000 by 2031 in high-cost areas
- National average growth is slower—closer to 6-7%
Job Market
Projected 10-year job growth is +1.5%, which is slower than average. However, this masks important regional variations.
Children’s hospitals in growing metropolitan areas continue to recruit aggressively, while rural and certain suburban markets face shortages. The aging pediatric surgery workforce—many practitioners are nearing retirement—will create openings over the next decade.
Additionally, the limited number of fellowship positions (approximately 40-50 per year nationally) ensures supply remains constrained. This supply-demand imbalance supports salary stability even with slow overall job growth.
The contrarian take: Slow job growth means fewer new entrants, which supports salary stability. But it also means fewer job openings—competition for desirable positions remains intense.
The Specialist Premium
Subspecialization within pediatric surgery commands a premium:
- Pediatric cardiothoracic: Highest paid within pediatrics
- Pediatric orthopedic: Solid but lower
- General pediatric surgery: Median range
The strategy: If you’re in training or early career, subspecializing pays off. The data is clear—cardiothoracic and orthopedic subspecialists earn more.
How Does Pediatric Surgery Compare to Other Specialties?
| Specialty | Median/Average Compensation |
|---|---|
| Neurosurgery | ~$750,000–$850,000+ |
| Orthopedic Surgery (Spine) | ~$750,000–$850,000+ |
| Cardiothoracic Surgery | ~$700,000–$800,000 |
| Pediatric Surgery | ~$510,000–$675,000 |
| General Surgery | ~$400,000–$500,000 |
Neurosurgery and orthopedic spine surgery consistently rank as the highest-paying surgical specialties. Some neurosurgeons clear $1.5 million in high-productivity practices.
Pediatric surgery sits in the upper-middle tier—below neurosurgery and orthopedics, but well above general surgery and most medical specialties.
The nuance: Pediatric surgeons often trade higher raw compensation for better work-life balance compared to neurosurgeons. But “better” is relative—55-62 hours is still brutal.
For more detailed compensation comparisons, explore our guides on Surgeon Salary, Neurosurgeon Salary, and Cardiologist Salary.
The Hidden Risks Nobody Talks About
1. The Benchmark Data Contradiction
One major physician compensation benchmarking database reports median pediatric surgeon compensation at roughly $308,000. That’s a massive outlier compared to every other source.
Why the gap? The sample may be underpowered for this subspecialty, or the database may track a different definition of compensation. Some benchmarking surveys have limited response rates for rare subspecialties.
The lesson: Don’t rely on a single data source. Cross-reference. Understand what each source actually measures.
2. The Bonus Dependency
Nearly all pediatric surgeons report receiving bonus compensation. The average bonus: approximately $101,000.
That means a significant chunk of your compensation is variable. If case volume drops, if RVU targets aren’t met, if hospital finances tighten—that bonus shrinks or disappears.
The risk: A $675,000 total comp package might have a $575,000 base and $100,000 at-risk bonus. In a bad year, you’re earning 15% less.
3. The Geographic Trap
High-salary states often have high costs of living—and high taxes.
- California’s top marginal state tax rate: 13.3%
- New York’s: 10.9%
- Texas: 0%
A $650,000 salary in California might net you less than a $550,000 salary in Texas. Always calculate after-tax, after-cost-of-living income.
4. The Hours Creep
The reported 55-62 hour weeks are averages. Many pediatric surgeons work more—especially early in their careers.
The hourly rate trap: At 62 hours, $675,000 is $209/hour. At 70 hours, it drops to $185/hour. That’s a meaningful difference.
5. The Gender Pay Gap
Recent compensation surveys indicate male pediatric surgeons earn approximately $776,000, while female counterparts earn about $671,000—a roughly 15.6% gap. This mirrors broader physician compensation patterns, though the gap in pediatrics is narrower than in some other surgical specialties.
Frequently Asked Questions
How much do pediatric surgeons make in 2026?
Pediatric surgeons earn between approximately $510,000 and $675,000 annually in 2026, with federal data showing a median around $559,000 and physician surveys showing higher figures when including bonuses. Top performers in the 90th percentile earn roughly $900,000 or more.
Is pediatric surgery financially worth it?
For most, yes. The 13-15 year training path is brutal, but the payoff is substantial. Pediatric surgeons earn roughly 2.5-3.5 times more than general pediatricians. The return on investment for the additional training is generally positive, though individual outcomes vary based on practice setting and location.
Which state pays pediatric surgeons the most?
California and New York show the highest nominal salaries, averaging around $642,000–$661,000. However, Texas and Florida offer competitive compensation with no state income tax, making the effective take-home pay more attractive than the nominal numbers suggest.
Can pediatric surgeons earn over $1 million?
Yes, but rarely. Top performers in the 90th percentile earn roughly $900,000+. Some highly productive pediatric surgeons in private practice or with significant administrative roles may exceed $1 million, but this is not typical.
How does pediatric surgeon salary compare to pediatrician salary?
Pediatric surgeons earn 2.5–3.5 times more than general pediatricians. The average pediatrician salary is around $198,000–$220,000, while pediatric surgeons earn $510,000–$675,000. The difference reflects the additional 7+ years of surgical training and the complexity of surgical care.
Is pediatric surgery competitive?
Extremely. Pediatric surgery fellowship is one of the most competitive subspecialty matches in medicine. The combination of high compensation, meaningful work, and limited training spots creates intense competition for residency and fellowship positions.
What’s the highest paid pediatric doctor?
Pediatric cardiothoracic surgeons are typically the highest paid within pediatrics, followed by general pediatric surgeons, then pediatric orthopedic surgeons. Compensation varies widely based on geographic location and practice setting.
How many pediatric surgeons are there in the U.S.?
Federal labor statistics estimate approximately 1,180 pediatric surgeons are employed in the U.S. This small number reflects the highly specialized nature of the field and contributes to the compensation premium.
What’s the job outlook for pediatric surgeons?
Moderate. Projected 10-year growth is +1.5%, which is slower than average. However, the aging pediatric surgery workforce and limited fellowship positions (40-50 per year nationally) ensure supply remains constrained, supporting salary stability.
Which surgical specialty has the highest growth potential?
Neurosurgery and orthopedic spine surgery have the highest compensation ceilings, with top earners exceeding $1 million annually. Within pediatrics, cardiothoracic surgery offers the highest pay and strong growth potential due to the complexity and specialization required.
Final Takeaway: What This Means for You
If you’re considering pediatric surgery:
The compensation is strong—top 5% of all earners. But the path is demanding: 13-15 years of training, competitive fellowship matching, and 55-62 hour weeks. The emotional demands are real. The rewards—both financial and professional—are substantial for those who make it through.
If you’re negotiating a pediatric surgery contract:
- Don’t anchor on a single number. The range is $510,000–$675,000. Your offer should reflect your experience, location, and practice setting.
- Focus on total compensation, not base salary. Bonuses average around $101,000—that’s real money.
- Run the after-tax, after-cost-of-living calculation. That $650K in California might not beat $550K in Texas.
- Understand the bonus structure. Is it guaranteed? RVU-based? Hospital-performance-based? Know what you’re signing.
- Negotiate the non-salary items. Call pay, PTO, CME allowance, relocation, signing bonus—these add up.
If you’re benchmarking your current salary:
- Cross-reference multiple sources. Government data, employer surveys, and peer-reported data all tell different parts of the story.
- Adjust for your specific factors. Experience, location, subspecialty, and practice setting all move the needle.
- Don’t ignore benchmarking databases. Even if some are outliers, they’re what many hospital systems use for compensation decisions.