
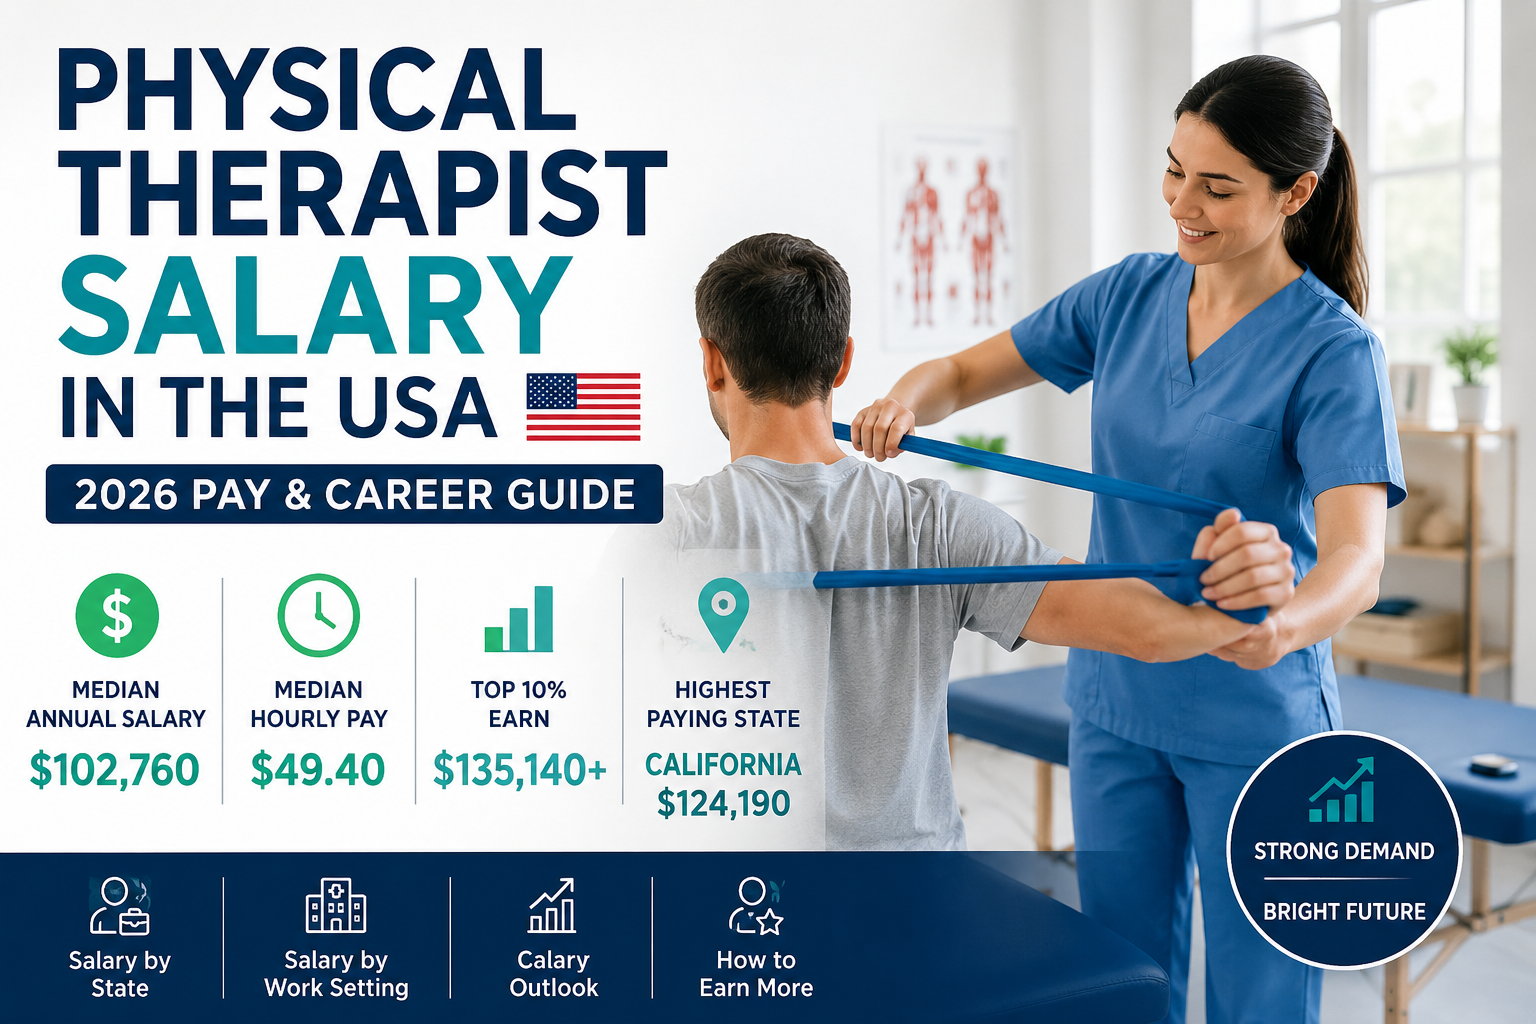
Physical Therapist Salary at a Glance
| Metric | 2025 U.S. PT Pay |
|---|---|
| Median annual salary | $102,760 |
| Median hourly pay | $49.40 |
| 10th percentile | $77,140 |
| 25th percentile | $86,160 |
| 75th percentile | $121,160 |
| 90th percentile | $135,140 |
Source: BLS/ONET May 2025 wage data
Physical therapists in the United States earn a national median of $102,760 per year, or $49.40 per hour, based on May 2025 wage data. The middle 50% earn roughly $86,160 to $121,160, while the top 10% earn $135,140 or more.
Here’s a fact that should give you pause: PT incomes have not kept pace with inflation since 2016, according to APTA workforce analysis. The profession became more educated — transitioning from bachelor’s to doctoral-level entry — yet real earnings have stagnated.
This single reality explains why this salary conversation matters more than most. It’s not about a number. It’s about whether this career still makes financial sense, and more importantly, how you can stop the erosion.
Let’s talk about what physical therapists really earn, why the numbers vary so dramatically, and what you can actually do about it. For broader context on U.S. compensation trends, see our average salary in the U.S. guide.
The National Picture: More Complex Than a Single Number
The Bureau of Labor Statistics puts the median annual wage for physical therapists at $102,760 as of May 2025, with an hourly equivalent of $49.40.
But the median tells only part of the story.
The full distribution reveals a profession with significant spread:
| Percentile | Annual Salary | Hourly Wage |
|---|---|---|
| 10th | $77,140 | $37.09 |
| 25th | $86,160 | $41.42 |
| Median | $102,760 | $49.40 |
| 75th | $121,160 | $58.25 |
| 90th | $135,140 | $64.97 |
Source: BLS/ONET May 2025 wage data
That’s a $58,000 gap between the bottom and top deciles. The difference isn’t random. It reflects choices about where you work, who you work for, and how you structure your career.
The fundamental tension in PT compensation is this: demand is soaring, supply is constrained, yet real wages have stagnated. The bottleneck isn’t patient demand — it’s reimbursement. Until payment models catch up with clinical value, salary growth will remain tethered to what insurers will pay, not what patients need.
What’s Actually Driving Physical Therapist Salaries
Understanding the why behind these numbers matters more than the numbers themselves.
Reimbursement rates are the invisible hand shaping PT compensation. Medicare, private insurers, and workers’ compensation set payment rates for physical therapy services. States with higher reimbursement rates — often those with more favorable payer mixes and fewer managed care constraints — support higher salaries.
Labor shortages amplify this effect. The American Physical Therapy Association’s 2025 workforce forecast projects a national shortfall of physical therapist FTEs reaching 8.2% in 2027 before narrowing to 3.3% by 2037. That’s not a future problem. That’s a market dynamic already pushing wages upward in competitive markets.
Demand growth outpaces population growth. Demand for PT services is forecast to grow 14.7% through 2037, compared with 8% population growth. An aging population, rising chronic condition prevalence, and the shift toward non-opioid pain management all contribute.
The shortage is real. The demand is growing. If you’re a PT, you have leverage you’re probably not using.
Where Physical Therapists Earn the Most (And Where They Don’t)
Location is the single biggest variable in PT compensation. But raw salary rankings tell only half the story.
Highest-Paying States for Physical Therapists (2025 Median Annual Wage)
| Rank | State | 2025 Median Wage |
|---|---|---|
| 1 | California | $124,190 |
| 2 | Nevada | $115,780 |
| 3 | Alaska | $114,310 |
| 4 | Texas | $105,810 |
| 5 | Illinois | $105,250 |
Source: BLS/ONET May 2025 wage data
Lowest-Paying States
| Rank | State | 2025 Median Wage |
|---|---|---|
| 1 | Louisiana | $68,490 |
| 2 | Georgia | $69,910 |
| 3 | Florida | $71,540 |
| 4 | North Dakota | $74,190 |
| 5 | Mississippi | $81,350 |
Source: BLS/ONET May 2025 wage data
Among the states shown here, the difference between California and Louisiana is about $55,700 a year. That looks decisive — and it pushes many PTs toward coastal and high-density markets.
But here’s where the conventional wisdom breaks down.
Cost of living can materially change the purchasing-power difference between states, so salary alone should not determine where you work. A PT earning $95,000 in Ohio may have more disposable income than one earning $124,000 in California. When evaluating job offers, calculate purchasing power, not just the headline number.
The highest nominal salary isn’t always the best financial decision. Always consider housing costs, taxes, and daily expenses before making a location-based career move.
The Experience Premium: How Earnings Accelerate (and Stall)
Entry-level physical therapists don’t earn the median. They earn substantially less. And the trajectory matters more than the starting point.
Quick Answer: New-graduate salaries commonly fall below the national median and vary substantially by state, setting, employer, and experience. The national 10th-percentile wage was $77,140 in 2025, but that figure should not be interpreted as an official new-graduate salary.
The experience premium follows a distinct pattern:
Years 0–3: Learning the clinical ropes. Earnings sit below the median. Productivity is lower. Documentation takes longer. This is the investment phase.
Years 4–7: Clinical efficiency improves. Caseloads increase. Many PTs pursue board certification during this window. Earnings accelerate toward and beyond the median.
Years 8–15: Peak earning years. Clinical expertise is established. Many PTs move into management, specialization, or ownership. The 75th percentile ($121,160) and above becomes achievable.
Years 15+: Salary growth often plateaus unless you transition into administration, teaching, or business ownership. The gender pay gap widens significantly around age 40, reaching approximately $16,000 annually by age 65.
PTs with 10-plus years of experience can reach or exceed $115,000 in higher-paying settings or markets, but earnings vary significantly by location, specialization, employer, and role.
Your earnings trajectory isn’t automatic. It reflects deliberate choices about specialization, setting, and career direction.
Work Settings: Where You Work Can Change What You Earn
Physical therapist compensation varies substantially by practice setting. It is important to understand that BLS industry wage data and APTA survey income data use different methodologies — so the highest-paying setting can differ depending on whether you compare mean wages, median reported income, or specific employment arrangements.
For example, the American Physical Therapy Association’s 2025 income report indicates that hospitals and inpatient rehabilitation facilities had the highest median reported PT incomes in its survey. Meanwhile, BLS industry-level data often shows home health care services and outpatient care centers among the top-paying settings. Rather than chasing a single “highest-paying” setting, PTs should evaluate total compensation, work-life balance, and career trajectory across settings.
The key takeaway: your choice of practice setting meaningfully affects your earnings — but the precise ranking depends on which dataset you consult.
The setting decision isn’t just about money. Home health offers higher pay but comes with driving time, documentation burden, and less peer support. Outpatient offers lower pay but better mentorship, specialization opportunities, and work-life balance. Know your trade-offs before you sign.
Employer Types: Who Pays Above Market
Not all employers compensate equally. Understanding employer behavior helps you target the right organizations.
Hospital systems often pay competitively but with rigid salary bands. Banner Rehabilitation Hospital, for example, offers $100,000 to $135,000 depending on experience, plus sign-on bonuses up to $20,000.
Large healthcare networks like Kaiser Permanente typically offer salaries in the $95,000 to $128,000 range. These organizations compensate for stability, benefits, and career mobility rather than top-of-market base pay.
Specialty practices and cash-based clinics often pay above market but with less job security. Olympic Sports & Spine offers $85,000 to $118,000 annually plus production incentives.
Private equity-backed therapy groups like ATI Physical Therapy and PT Solutions offer base salaries from $85,000 to $115,000. These organizations often provide clear advancement paths but higher productivity expectations.
H-1B visa salary data reveals that some employers pay significantly above the median. Prime Healthcare Services Inc. reported $118,000 for PT positions. Bay State Physical Therapy reported $124,000.
The highest-paying employers are rarely the ones with the most prestigious names. They’re the ones with the tightest labor markets, the most challenging patient populations, or the most demanding productivity targets. Higher-paying roles often come with higher productivity expectations, greater responsibility, or less predictable working conditions.
Specializations: The Certification Premium
Board certification isn’t just professional development — it’s a compensation strategy.
Sports physical therapy salaries typically range from $85,000 to $98,000 nationally, with some positions reaching $95,000 to $110,000 in competitive markets. The premium over general PT practice is modest but real.
Pediatric physical therapy shows wider variation. National averages hover around $89,000, but senior pediatric PTs with 8+ years can earn $148,000 in high-cost markets.
Geriatric physical therapy — particularly in skilled nursing and long-term care — reports median annual income around $105,000. This setting often pays well but carries higher documentation burdens and regulatory complexity.
Board-certified clinical specialists in orthopedics, neurology, or sports typically earn more than generalists. The premium varies by market but generally ranges from 5 to 15 percent above non-specialized peers.
The certification decision matters most in the 4-to-10-year career window. Early-career PTs should pursue specialization strategically — not for the immediate pay bump, but for the career positioning it enables.
ABPTS specialty certification requires documented specialty-related clinical experience and successful completion of the certification process; requirements vary by specialty and pathway.
The Travel PT Option: Higher Pay, Different Life
Travel physical therapy deserves its own discussion because the compensation model is fundamentally different.
Rather than a straight salary, travel PTs receive:
- Taxable hourly wages (typically $25–$45 per hour)
- Tax-advantaged stipends for housing and meals (subject to tax-home requirements)
- Travel reimbursements
- Completion bonuses
Total weekly compensation frequently ranges from $1,820 to $3,000 in gross terms. At the higher end, that’s roughly $156,000 annually in total compensation.
The catch is obvious: you’re moving every 8 to 13 weeks. You’re learning new documentation systems, new facility protocols, and new team dynamics constantly. You’re away from home, often in less desirable locations that have the greatest staffing shortages.
Stipends are not automatically tax-free. Their tax treatment depends on the worker satisfying relevant tax-home requirements, including maintaining a permanent residence and duplicating living expenses. Consult a tax professional before assuming any portion of compensation is tax-free.
Reality Check: Travel PT makes financial sense for early-career PTs who want to pay down student debt quickly. It makes less sense for PTs with families, established communities, or career aspirations that require continuity.
Benefits and Total Compensation: What the Base Salary Hides
Base salary is only one component of total compensation. Benefits packages vary dramatically and can add 20 to 30 percent to the value of an offer.
Sign-on bonuses in competitive markets range from $8,500 to $20,000. These are typically paid upfront with a 1-to-2-year commitment.
Student loan repayment programs are increasingly common. Some employers offer $350 per month in loan assistance. For PTs graduating with six-figure student debt, this benefit can be worth more than a salary bump.
Continuing education allowances typically range from $1,500 to $3,000 annually. For PTs required to maintain board certification, this is essential, not optional.
Retirement contributions vary from 3 to 6 percent employer matches in most healthcare systems, with some offering up to 4 percent.
Productivity bonuses and production incentives are common in private practice and outpatient settings. Olympic Sports & Spine offers production incentives on top of base salaries ranging from $85,000 to $118,000.
When comparing job offers, calculate total compensation, not just base salary. A $95,000 offer with a $10,000 sign-on bonus, $3,000 CE allowance, and 5% 401(k) match may be worth more than a $105,000 offer with minimal benefits.
The Gender Pay Gap: An Uncomfortable Reality
The APTA’s 2025 workforce data reveals something the salary surveys rarely discuss: a gender pay gap that widens with age.
Differences in earnings by gender begin to emerge around age 40, with a widening gap that reaches approximately $16,000 annually by age 65. The APTA 2025 income report explicitly notes that this gap becomes statistically significant around age 40.
The gap isn’t explained by experience or credentials alone. It reflects a combination of factors:
- Career interruptions for family responsibilities
- Differential access to leadership and ownership opportunities
- Negotiation patterns
- Setting choices that correlate with gender
This gap represents a systemic issue, not individual failure. But individual PTs — regardless of gender — can protect their earnings by negotiating proactively, seeking leadership opportunities, and understanding their market value.
The Shortage: Your Leverage Point
The physical therapist shortage isn’t theoretical. It’s reshaping labor markets right now.
The APTA workforce forecast projects a fluctuating shortfall through 2037. About 72% of PTs report either a shortage in capacity to meet local demand (57%) or being at the limit of their capacity (24.1%).
About 5% of PTs plan to retire or leave the profession in the next year. The highest departure rates are in home care (9%) and skilled nursing facilities (8.9%) — precisely the settings where demand is strongest.
13,200 annual openings are projected each year through 2034. Many result from replacement needs, not just growth.
This shortage creates leverage. In markets with acute shortages, employers are offering higher base salaries, larger sign-on bonuses, and more flexible arrangements.
Your negotiating power is strongest in markets with documented shortages. Research local demand before you enter salary discussions. If your market has multiple unfilled PT positions, you have leverage you’re probably not using.
The 5-Year Outlook: What’s Coming
The next five years will reshape PT compensation in several ways.
Demand will continue growing. The BLS projects 11% employment growth from 2024 to 2034, much faster than the average for all occupations. That projection reflects long-term demographic and healthcare-demand trends.
The shortage will peak around 2027. The APTA forecast shows the shortfall reaching 8.2% in 2027 before gradually declining. That means the tightest labor market — and the strongest negotiating position for PTs — is still ahead.
Reimbursement pressure will persist. Medicare payment rates and commercial insurer policies remain the binding constraint on salary growth. Until reimbursement catches up with demand, salary growth will remain modest.
Technology will change practice. AI exposure in physical therapy is relatively low compared to other professions, but documentation automation, telehealth, and remote monitoring will reshape how PTs work. These changes may improve productivity — and potentially, compensation.
The PT labor market will remain tight through 2030, but salary growth will lag demand growth unless reimbursement rates increase. The biggest opportunities for earnings growth will come from specialization, setting choice, and practice ownership — not from annual raises.
Comparing Physical Therapist Pay to Other Healthcare Careers
Understanding where PT compensation sits relative to other healthcare professions helps contextualize career decisions.
| Profession | Approx. Annualized Pay (2025) |
|---|---|
| Nurse Anesthetists (CRNA) | $236,590 |
| Nurse Practitioners | $132,300 |
| Physical Therapists | $102,760 |
| Registered Nurses | $97,550 |
| Radiologic Technologists | $80,110 |
| Medical Assistants | $45,690 |
Source: BLS Occupational Employment and Wage Statistics, May 2025. Annualized figures are shown for comparison based on BLS wage data.
PTs earn more than physical therapist assistants (median ~$68,380) and medical assistants, but less than physician assistants, nurse practitioners, and physicians. The profession sits in the middle tier of healthcare compensation — above allied health, below advanced practice providers.
For comparison data on other healthcare careers, see our guides on registered nurse salary , nurse practitioner salary , and CRNA salary .
The PT salary premium over registered nurses varies significantly by state. In some markets, PTs earn substantially more than RNs. In others, the gap is narrow or reversed. Research your local market before assuming PT pays better.
The Biggest Salary Myths About Physical Therapy
Myth 1: “All PTs earn about the same.” The $58,000 gap between the 10th and 90th percentiles disproves this. Your choices matter more than your degree.
Myth 2: “California always pays the most.” Raw salaries yes. Purchasing power no. Once you adjust for cost of living, several Midwest states offer better real income.
Myth 3: “Experience guarantees higher pay.” Experience helps until it doesn’t. Salary growth often plateaus after 15 years unless you transition into management, ownership, or specialization.
Myth 4: “The DPT degree guarantees a high salary.” The DPT is the entry ticket, not the destination. Your salary reflects your market, setting, specialization, and negotiation — not your diploma.
Myth 5: “The highest salary is always the best offer.” Total compensation, work-life balance, career trajectory, and cost of living all matter more than the headline number.
Career Strategy: What You Can Actually Do
Based on everything above, here’s what actually moves the needle:
Negotiate your starting salary. Most PTs don’t negotiate. Research shows healthcare professionals consistently leave money on the table by accepting the first offer. Research your market, set a specific target, and ask for it.
Choose your setting strategically. Home health and travel pay more. Outpatient offers better career progression. Know what you’re optimizing for.
Pursue board certification. The certification premium is real, and it compounds over a career.
Consider cost of living in location decisions. A lower salary in a lower-cost market often beats a higher salary in a high-cost market.
Move into management or ownership. For many staff-clinician roles, compensation becomes harder to increase substantially without moving into higher-paying settings, leadership, specialization, contracting, or ownership.
Understand your employer’s values. Some employers prioritize clinical quality. Others prioritize productivity. Align your negotiation strategy with what they actually value.
Know your worth. Use the BLS, APTA, and state wage data to benchmark your compensation. If you’re below market, make the case.
Risks and Realities
Salary stagnation is the biggest risk. Real wages for PTs have declined since 1990 when adjusted for inflation. This trend may continue unless reimbursement rates increase. Recent APTA analysis suggests PT incomes have not kept pace with inflation since 2016.
Reimbursement cuts pose an ongoing threat. Medicare and commercial insurers periodically reduce payment rates, which directly impacts what employers can pay.
Burnout drives departure from the profession. About 5% of PTs plan to leave annually. The settings with the highest departure rates — home care and skilled nursing — are also the ones with the highest pay. Money doesn’t always compensate for working conditions.
Student debt is a structural burden. The DPT requires seven years of education. Six-figure student debt is common. Salary growth must outpace debt service for the profession to remain financially viable.
The PT profession offers stable employment and meaningful work. But it’s not a path to significant wealth unless you pursue ownership, specialization, or management. Understand this before you commit.
SalaryInfo Editorial Verdict
Physical therapy offers a stable, growing career with a median salary around $102,760. The work is meaningful. The demand is secure. The shortage creates leverage.
But the profession faces structural challenges. Real wages have stagnated. Reimbursement constrains growth. Student debt burdens new graduates.
The PTs who earn above the median aren’t lucky. They made strategic choices about location, setting, specialization, and negotiation. They understood that the DPT is the starting point, not the finish line.
If you’re considering this career, understand the economics before you commit. If you’re already a PT, understand your leverage and use it.
The shortage is real. The demand is growing. The question isn’t whether PTs are needed — it’s whether PTs will be compensated for the value they deliver.
Featured Snippets
What is the average salary for a physical therapist in the US?
The median annual salary for physical therapists in the United States is $102,760 as of May 2025, according to BLS/O NET data. The top 10% earn over $135,140 and the bottom 10% earn below $77,140. The median hourly wage is $49.40.
What type of physical therapist makes the most money?
Travel physical therapists and home health PTs typically earn the highest compensation. Travel roles often pay $120,000–$145,000 annually plus housing stipends, while home health PTs are among the top earners in BLS industry data. Board-certified specialists in sports, orthopedics, and neurology also command significant premiums.
Which state pays physical therapists the highest salary?
California pays the highest salary for physical therapists at $124,190 median annually, followed by Nevada at $115,780 and Alaska at $114,310. However, when adjusted for cost of living, states like Texas and Nevada often offer better purchasing power than California.
How much does a physical therapist earn per month in the US?
Based on the median annual salary of $102,760, a physical therapist earns approximately $8,563 per month before taxes. The monthly equivalent ranges from about $6,428 at the 10th percentile to $11,262 at the 90th percentile.
Is physical therapy a growing career in the US?
Yes. Employment of physical therapists is projected to grow 11% from 2024 to 2034, much faster than the average for all occupations. About 13,200 openings are projected annually, driven by an aging population and increasing chronic conditions.
FAQs
What type of PT makes the most money?
Travel physical therapists and home health PTs consistently earn high compensation. Travel roles can reach $120,000–$145,000 annually plus tax-advantaged stipends, while home health PTs are among the top earners in BLS setting data. Board-certified specialists in sports, orthopedics, and neurology also command premium pay.
How much is a physical therapist paid in the USA?
The median annual wage is $102,760 as of May 2025, or $49.40 per hour. The full range spans from $77,140 at the 10th percentile to $135,140 at the 90th percentile. Actual pay varies significantly by state, setting, and experience.
How much does a physical therapist make per hour?
The median hourly wage for physical therapists in the United States is $49.40 based on May 2025 data. Hourly rates range from $37.09 at the 10th percentile to $64.97 at the 90th percentile. Home health and travel PTs often earn substantially higher hourly rates.
What is the average physical therapist salary by state?
State salaries vary significantly, with California leading at $124,190, followed by Nevada ($115,780) and Alaska ($114,310). Lower-paying states include Louisiana ($68,490), Georgia ($69,910), and Florida ($71,540). Cost of living significantly affects real purchasing power.
Do physical therapists make six figures?
Many do. The median salary is just over $100,000 annually. However, approximately half of PTs earn below this threshold. Earning six figures typically requires several years of experience, favorable location, or a higher-paying setting like home health or travel PT.
How much does a new grad physical therapist make?
New-graduate salaries commonly fall below the national median and vary substantially by state, setting, employer, and experience. The national 10th-percentile wage was $77,140 in 2025, but that figure should not be interpreted as an official new-graduate salary.
Is physical therapy worth the student debt?
The ROI depends on your career choices. The DPT requires seven years of education, often with six-figure debt. PTs who pursue high-paying settings, specialization, or management can achieve strong returns. Those who remain in lower-paying settings may struggle with debt service relative to income.
Can physical therapists earn over $150,000?
Yes, but it requires exceptional circumstances. Travel PTs can exceed $150,000 in total compensation including stipends. Clinic directors, practice owners, and PTs in extremely high-cost markets can also reach this level. It is not typical for staff clinicians.
Do physical therapists get paid hourly or salary?
Both. Many outpatient and hospital positions offer salaried compensation, while home health, travel, and per diem roles often pay hourly. Hourly rates for home health frequently range from $70 to $85 per hour for experienced clinicians.
How does physical therapist pay compare to other healthcare professions?
PTs earn more than physical therapist assistants (median ~$68,380) and medical assistants, but less than physician assistants, nurse practitioners, and physicians. The profession sits in the middle tier of healthcare compensation — above allied health, below advanced practice providers.
What country pays physical therapists the most?
The United States consistently ranks among the highest-paying countries for physical therapists, with median salaries around $102,760. Switzerland, Australia, and Canada also offer competitive compensation, but US salaries remain among the global leaders for this profession.
Is the physical therapist shortage real?
Yes. The APTA forecasts a national shortfall reaching 8.2% in 2027, with demand growth of 14.7% through 2037. About 72% of PTs report capacity constraints in meeting local demand. This shortage creates negotiating leverage for PTs in many markets.
What skills do employers value most for physical therapists?
Employers value clinical competence, documentation efficiency, patient communication, and productivity. Specialization, board certification, and experience in high-demand settings (home health, travel) command premium pay. Leadership skills become increasingly valuable for career advancement.
How much does a physical therapist with 10 years experience make?
PTs with 10-plus years of experience can reach or exceed $115,000 in higher-paying settings or markets, but earnings vary significantly by location, specialization, employer, and role. Board certification and management positions typically command premium pay.