
27 Hourly to Salary
The median weekly wage for full-time US workers hit $1,251 in the second quarter of 2026, according to the Bureau of Labor Statistics. That annualizes to roughly $65,052—meaning $27 an hour ($56,160/year) lands about 14% below the median full-time worker.
Here’s what’s actually happening: wages have climbed faster in the past two years than in the previous decade, largely driven by labor shortages in healthcare, logistics, and skilled trades. Employers are paying more for workers they couldn’t attract at $22 or $24 an hour. But $27? In 2026, that number lands in a complicated spot—decent in the Midwest, stretched thin in coastal cities, and increasingly common in fields that didn’t pay this well five years ago.
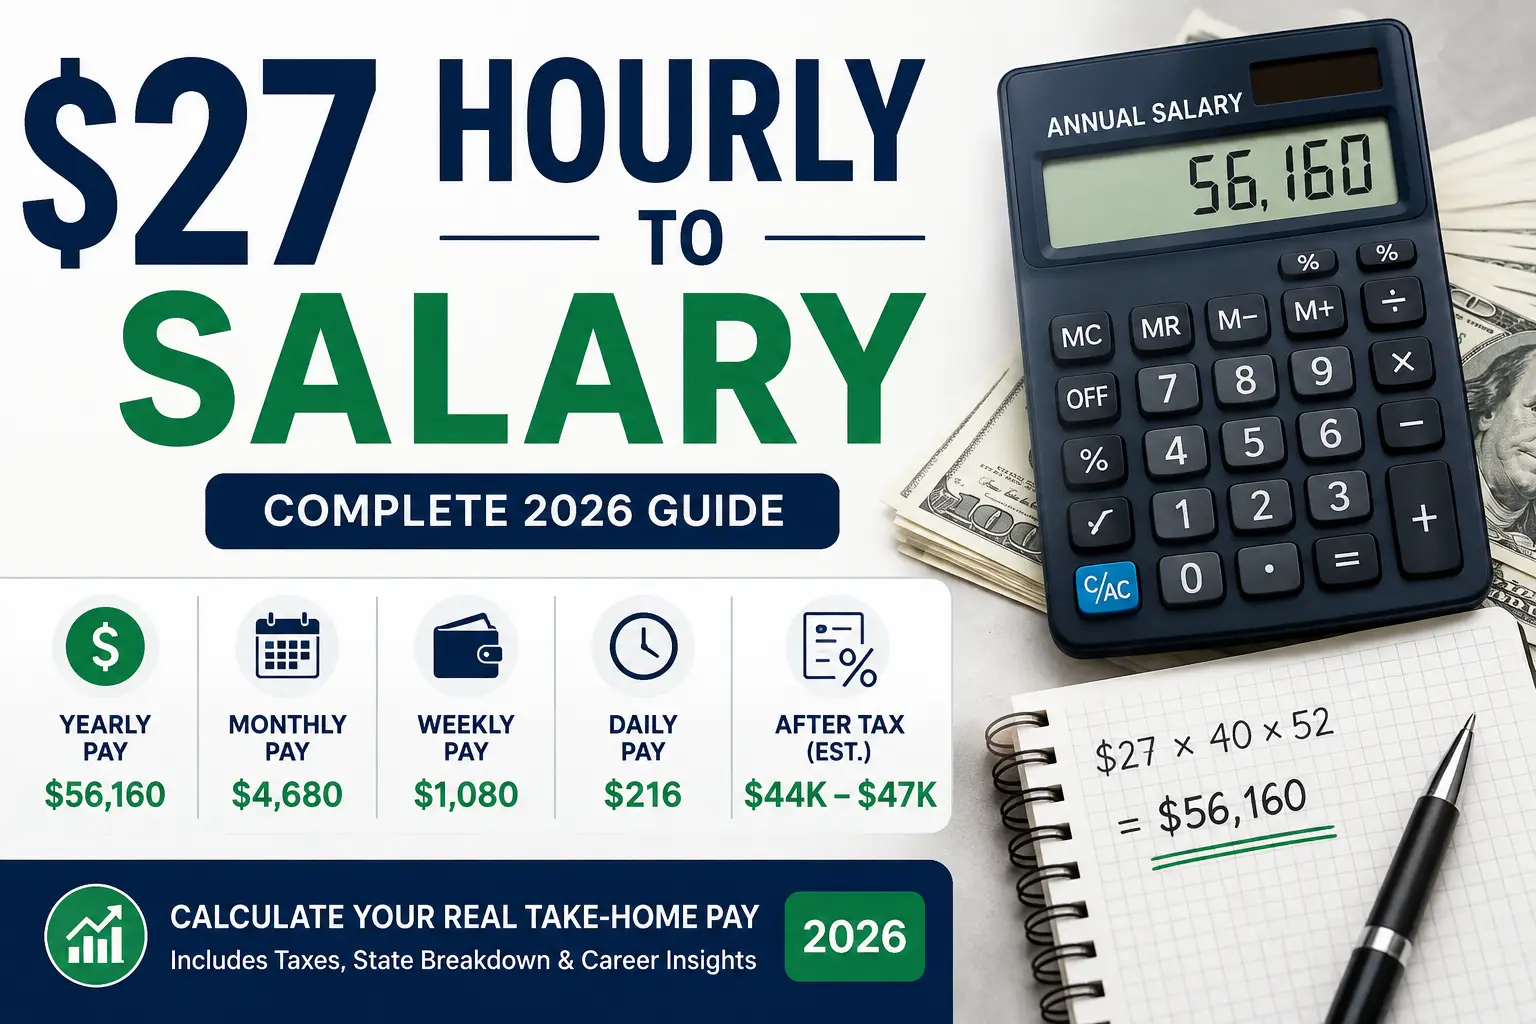
If you earn $27 per hour and work a standard 40-hour week, your estimated gross annual salary is $56,160 before taxes. That works out to approximately $4,680 per month, $2,160 every two weeks, and $1,080 per week.
After federal income taxes, a single filer earning $27 per hour typically takes home approximately $44,000–$47,000 per year. Actual net pay depends on your state income taxes, filing status, retirement contributions, health insurance premiums, and other payroll deductions.
How We Calculate Salary
Salary Formula: Hourly Rate × Hours per Week × 52 Weeks = Annual Salary
$27 × 40 × 52 = $56,160
This calculation assumes 40 hours per week and 52 weeks per year, the industry standard for full-time employment.
27 Hourly to Salary: Salary Calculator
The Numbers That Actually Matter
Before diving into tax tables and cost-of-living adjustments, here’s the straightforward conversion:
| Pay Period | Gross Pay (40 hrs/week, 52 weeks) |
|---|---|
| Hourly | $27.00 |
| Daily (8 hours) | $216.00 |
| Weekly (40 hours) | $1,080.00 |
| Biweekly (80 hours) | $2,160.00 |
| Monthly (annual ÷ 12) | $4,680.00 |
| Yearly (2,080 hours) | $56,160.00 |
The standard calculation uses 2,080 working hours per year (40 hours × 52 weeks). Some calculators adjust for paid time off—typically 1,920 to 1,960 actual working hours after accounting for 2–3 weeks of PTO and holidays. If you’re salaried with 15 days of vacation and 10 federal holidays, your actual working hours drop to around 1,960, which changes the effective hourly value of your salary. But for apples-to-apples comparisons, the industry standard remains 2,080 hours.
Use our tools: If you want to calculate your own salary conversions, check out our CTC Calculator or Salary Slip Generator to understand your total compensation package.
After Taxes: What You Actually Keep
$56,160 looks solid on paper. What lands in your bank account is a different story.
Federal Taxes (2026 Rates)
For the 2026 tax year, the IRS announced the following brackets and standard deduction amounts:
| Tax Rate | Single Filers | Married Filing Jointly |
|---|---|---|
| 10% | $0 – $12,400 | $0 – $24,800 |
| 12% | $12,401 – $50,400 | $24,801 – $100,800 |
| 22% | $50,401 – $105,700 | $100,801 – $211,400 |
| 24% | $105,701 – $201,775 | $211,401 – $403,550 |
| 32% | $201,776 – $256,225 | $403,551 – $512,450 |
| 35% | $256,226 – $640,600 | $512,451 – $768,700 |
| 37% | Over $640,600 | Over $768,700 |
Standard Deduction for 2026:
- Single filers: $16,100
- Married filing jointly: $32,200
- Heads of household: $24,150
A single filer earning $56,160 takes the standard deduction of $16,100, bringing taxable income to approximately $40,060. That puts them squarely in the 12% bracket. Federal income tax liability comes to roughly $4,200–$4,500. Add Social Security (6.2%) and Medicare (1.45%) —another $4,300 combined—and total federal withholdings land around $8,500–$9,000 before state taxes.
SalaryInfo Insight: Many workers overestimate their tax burden at this income level. The effective federal tax rate on $56,160 is closer to 15% than 22%, because the 22% bracket only applies to income above $50,400. The actual federal tax hit is about $8,500—not $12,000.
Use our Income Tax Calculator to estimate your exact take-home pay based on your specific filing status and deductions.
State Tax Impact (2026)
Where you live changes everything. The five states with the highest personal income tax rates in 2026 are California (13.3%), Hawaii (11%), New York (10.9%), New Jersey (10.75%), and Oregon (9.9%).
| State | State Income Tax | Approx. Annual Take-Home (Single, No Deductions) | Key Notes |
|---|---|---|---|
| Texas | 0% | ~$47,600 | No state income tax |
| Florida | 0% | ~$47,600 | No state income tax |
| Washington | 0% | ~$47,400 | WA Cares Fund deduction applies |
| Illinois | 4.95% flat | ~$45,500 | Flat tax, simple calculation |
| New York | Up to 10.9% | ~$43,500–$44,500 | NYC local tax adds more |
| California | Up to 13.3% | ~$42,000–$43,000 | Highest state income tax |
| New Jersey | Up to 10.75% | ~$43,000–$44,000 | High property taxes offset some savings |
Reality Check: A worker in Texas or Florida keeps roughly $4,000–$5,000 more per year than an identical worker in California or New York City at the same $27/hour gross rate. That difference is real money—$330 to $420 per month that never reaches your pocket.
Texas example: At $27/hour, gross biweekly pay is $2,160. After federal and FICA taxes, take-home is approximately $1,760 per biweekly paycheck.
Florida example: Similar to Texas—no state income tax, take-home around $1,760 biweekly.
Illinois example: The 4.95% flat state tax adds roughly $2,780 annually in state withholdings, reducing take-home to about $45,500.
Washington example: No income tax, but the WA Cares Fund (0.58%) and Paid Family & Medical Leave contributions add approximately $1,000 annually in payroll deductions.
Is $27 an Hour Actually Good in 2026?
This is the question behind the search. The answer depends entirely on where you live and what you do.
The National Benchmark
The median weekly wage for full-time US workers in Q2 2026 was $1,251, which annualizes to roughly $65,052. At $27/hour ($56,160/year), you’re earning about 14% below the median full-time worker.
For production and nonsupervisory employees in the private sector—the closest proxy for hourly workers—the average hourly earnings reached $32.38 in June 2026. At $27/hour, you’re earning approximately 17% below that benchmark as well.
Correction: Earlier versions of this article stated $27/hour was “above” the production worker average. That was incorrect. The $32.38/hour figure represents the average for production and nonsupervisory employees, and $27/hour is below it. This guide has been corrected to reflect accurate wage comparisons.
Cost of Living Reality
Here’s where the numbers get uncomfortable:
- In Mississippi or Arkansas: $27/hour supports a solid middle-class lifestyle. A two-bedroom apartment runs $1,000–$1,400/month. Your $4,680 gross monthly income goes far.
- In Dallas or Phoenix: $27/hour is comfortable but not lavish. Rent at $1,600–$2,000/month consumes 35–43% of gross income.
- In Chicago or Portland: $27/hour is tight. Rent at $2,000–$2,500/month pushes housing costs past 50% of gross income.
- In NYC, LA, or San Francisco: $27/hour is survival-level. Market-rate studios in Manhattan start at $3,000+/month. After taxes, you’re left with roughly $3,600–$3,900 per month—and rent alone takes 80%+.
SalaryInfo Observation: A $27/hour wage that feels like a win in St. Louis feels like a loss in San Jose. The same gross pay produces wildly different lifestyles. Any salary discussion that ignores location is incomplete.
Who Earns $27 an Hour in 2026?
Glassdoor data shows $27/hour appearing across a wide range of roles:
- Surgical Technicians: ~$27/hour nationally
- HR Assistants: ~$27/hour (8% below national average in some markets)
- Dispatchers: ~$27/hour in certain states
- Journeyman Plumbers: $25–$27/hour in some markets
- Warehouse Workers: Top earners at ~$27/hour in Texas
- Video & Livestream Specialists: Starting at $27.01/hour in municipal roles
What’s striking is the diversity. $27/hour spans entry-level healthcare, skilled trades, administrative roles, and even some creative positions. It’s not tied to one industry—it’s a wage floor that’s rising across multiple sectors.
Learn more: Compare these roles to other salaries:
- Registered Nurse Salary – typically $35–$50/hour
- Electrician Salary – $25–$45/hour
- Data Analyst Salary – $30–$50/hour
Which Employers Pay $27 an Hour or More?
The employer landscape for $27/hour workers shifted significantly in 2025–2026. Here’s what the job market actually looks like:
Healthcare
Healthcare employers consistently pay above $27/hour for licensed roles:
- NL Health Services pays Licensed Practical Nurses $30.16–$33.22/hour
- Speech Language Pathologists in some regions earn $43.00–$53.60/hour
- Travel nursing and allied health roles regularly start at $30+/hour
Skilled Trades
- General Motors electricians earn approximately $29/hour
- Journeyman Plumbers in Montgomery, AL: $25–$27/hour
- CDL-A drivers for McLane Company earn $88,000–$97,000/year (roughly $42–$47/hour)
Retail & Management
- Goodwill of the San Francisco Bay Retail Store Manager in Training: ~$37/hour estimated
- Assistant managers at quick-service restaurants: $28/hour in some markets
Government & Municipal
- Longmont, CO Video and Livestream Digital Specialist: $27.01/hour starting
- Federal GS pay scales with locality adjustments often hit $27+ in mid-grade positions
SalaryInfo Market View: The highest-paying employers for $27/hour roles aren’t necessarily the ones with the biggest name recognition. Regional healthcare systems, municipal governments, and logistics companies frequently outpay national retail chains. Job seekers should look beyond brand names to local employers with tight labor markets.
See also: Explore Walmart Salary and Costco Salary to see how retail giants compare.
Salary by State: Where $27/Hour Goes Furthest
State income tax is only half the story. Cost of living, housing availability, and local job density determine actual purchasing power.
No-Tax States (Highest Take-Home)
- Texas, Florida, Washington, Tennessee, Wyoming, Nevada, South Dakota, Alaska, New Hampshire
- Take-home pay: ~$47,400–$47,600/year at $27/hour
- But: housing costs vary wildly within these states. Austin and Miami are expensive; Amarillo and Jacksonville are not.
Moderate-Tax States
- Illinois (4.95% flat): ~$45,500 take-home
- Pennsylvania (3.07% flat): ~$46,200 take-home
- Indiana (3.0% flat): ~$46,300 take-home
- Michigan (4.25% flat): ~$45,800 take-home
High-Tax States
- California (up to 13.3%): ~$42,000–$43,000 take-home
- New York (up to 10.9% + NYC local tax): ~$43,000–$44,000
- Oregon (up to 9.9%): ~$43,500 take-home
- New Jersey (up to 10.75%): ~$43,000–$44,000
Reality Check: A worker in Texas earning $27/hour takes home roughly $4,500 more per year than a worker in California at the same gross rate. Over five years, that’s a $22,500 difference—enough for a car, a down payment on a modest home, or a significant boost to retirement savings.
How $27/Hour Compares to Other Hourly Rates
To give you a broader perspective, here’s how $27/hour stacks up against other common hourly rates:
| Hourly Rate | Weekly (40 hrs) | Monthly (Annual ÷ 12) | Annual (2,080 hrs) |
|---|---|---|---|
| $25.00 | $1,000 | $4,333 | $52,000 |
| $26.00 | $1,040 | $4,507 | $54,080 |
| $27.00 | $1,080 | $4,680 | $56,160 |
| $28.00 | $1,120 | $4,853 | $58,240 |
| $29.00 | $1,160 | $5,027 | $60,320 |
| $30.00 | $1,200 | $5,200 | $62,400 |
| $35.00 | $1,400 | $6,067 | $72,800 |
| $40.00 | $1,600 | $6,933 | $83,200 |
| $50.00 | $2,000 | $8,667 | $104,000 |
Key Takeaway: Jumping from $27 to $30 per hour adds $6,240 annually—a meaningful increase that can significantly improve your budget. This is why salary negotiation matters, even for hourly roles.
Hourly vs. Salary: The Hidden Trade-Offs
$27/hour at 40 hours per week equals $56,160/year—but the comparison isn’t that simple.
Overtime Changes Everything
At $27/hour, overtime (time-and-a-half) pays $40.50/hour. A worker who averages just 5 hours of overtime per week adds roughly $10,530 to annual earnings, pushing total compensation to $66,690.
Key Takeaway: Hourly workers with overtime opportunities often out-earn salaried workers with the same base rate. A $27/hour warehouse worker with consistent overtime can surpass a $60,000/year salaried office worker.
Use our Overtime Calculator to see exactly how much extra you could earn with consistent overtime.
Benefits Gap
Salaried roles typically include:
- Paid time off (2–4 weeks)
- Health insurance with employer contributions
- 401(k) matching
- Bonus potential
- Career progression pathways
Hourly $27/hour roles often include some benefits but may offer fewer paid days off and less generous retirement contributions. Employer costs for private industry workers averaged $32.38/hour for wages in June 2026, with benefits adding significantly to total compensation.
SalaryInfo Career Strategy: When comparing a $27/hour job to a salaried offer, calculate total compensation—not just base pay. Add the value of health insurance, 401(k) matching, PTO, and bonuses. A $56,000 salary with full benefits often beats a $27/hour role with minimal benefits, even before overtime.
Career Trajectory: How to Move Beyond $27/Hour
$27/hour is a solid wage, but it’s rarely the ceiling. Here’s how workers typically progress:
Experience Premium
| Experience Level | Typical Hourly Range | Key Skills That Drive Growth |
|---|---|---|
| 0–2 Years | $22–$27 | Basic competence, reliability |
| 3–5 Years | $27–$33 | Specialized knowledge, independence |
| 5–10 Years | $33–$42 | Supervision, training, complex problem-solving |
| 10+ Years | $40–$55+ | Management, strategic direction, industry expertise |
Certifications That Pay Off
In many fields, specific certifications unlock higher wages:
- Healthcare: LPN to RN (adds $10–$15/hour)
- Skilled Trades: Journeyman to Master (adds $8–$12/hour)
- Logistics: CDL with endorsements (adds $5–$10/hour)
- IT: Security+ or Network+ (adds $10–$20/hour)
SalaryInfo Observation: The fastest path from $27/hour to $35+/hour is often a single certification or license—not years of experience. Healthcare and trades reward credentials more than tenure.
Learn more: Compare career paths:
- Registered Nurse Salary – RNs earn $35–$50/hour
- Nurse Practitioner Salary – $45–$65/hour
- CRNA Salary – $100–$150/hour
- Software Engineer Salary – $40–$70/hour
Promotion Timeline
In many industries, the progression looks like:
- Year 1–2: Learn the role, prove reliability
- Year 3–4: Take on additional responsibilities, train others
- Year 5: Promotion to lead or supervisor (typically $30–$35/hour)
- Year 7–10: Management or senior specialist ($35–$45/hour)
Important Note: Not all industries offer clear promotion pathways. Retail and hospitality often have limited upward mobility. Healthcare, logistics, and skilled trades offer more structured career ladders.
Industry Outlook: Where $27/Hour Roles Are Growing
Healthcare (Strong Growth)
The healthcare sector is the largest employer of $27–$35/hour workers. Demand for:
- Licensed Practical Nurses
- Medical Assistants (with experience)
- Radiology Technicians
- Surgical Technologists
All face labor shortages. BLS projections show healthcare adding more jobs than any other sector through 2030.
Learn more: Explore related healthcare salaries:
- Cardiologist Salary – $200,000–$400,000/year
- Surgeon Salary – $250,000–$500,000/year
- Radiology Tech Salary – $28–$40/hour
- Medical Assistant Salary – $18–$25/hour
Logistics & Supply Chain (Moderate Growth)
Warehouse workers, CDL drivers, and dispatchers at $27/hour are increasingly common. Automation is a risk—warehouse robotics and autonomous trucks could reduce demand for some roles—but the transition will take years. For now, labor shortages keep wages high.
Skilled Trades (Strong Growth)
Plumbers, electricians, HVAC technicians, and welders routinely earn $27–$45/hour. The shortage of young workers entering trades means wages will likely continue rising. Apprenticeship programs are the primary entry point.
Learn more:
- Electrician Salary – $25–$45/hour
- Underwater Welder Salary – $30–$60/hour
- Civil Engineering Salary – $30–$55/hour
Manufacturing (Moderate Growth)
Advanced manufacturing roles—CNC operators, maintenance technicians, quality inspectors—pay $25–$35/hour. Automation is reducing headcount in some facilities, but skilled technicians remain in demand.
Retail & Hospitality (Slow Growth)
$27/hour is relatively high for retail and hospitality. Most roles pay $15–$22/hour. Management positions can reach $27+, but competition is intense and turnover is high.
The Salary Ceiling: How High Can $27/Hour Go?
At $27/hour, you’re already above the federal minimum wage of $7.25 (unchanged since 2009). But where does the ceiling sit?
Without Additional Education or Certification
- Typical ceiling: $32–$35/hour
- With overtime: $40–$45/hour effective
- With shift differentials: $30–$33/hour for nights/weekends
With Certification or License
- Typical ceiling: $40–$50/hour
- Examples: RN ($35–$50), Master Electrician ($40–$55), CDL with Hazmat ($30–$40)
With Management Promotion
- Typical ceiling: $45–$65/hour (salaried equivalent)
- Examples: Warehouse Manager, Clinic Manager, Construction Foreman
SalaryInfo Verdict: $27/hour is a strong starting point, but it’s not a terminal wage. Most workers can expect to reach $32–$35/hour within 3–5 years with intentional career development. Those who pursue certifications or management roles can push past $40/hour.
Common Myths About $27/Hour
Myth 1: $27/hour is above average for hourly workers.
Reality: The average hourly earnings for production and nonsupervisory employees in the private sector was $32.38 in June 2026. At $27/hour, you’re earning about 17% below that average. It’s not a low wage, but it’s not above the average for hourly workers either.
Myth 2: Salary calculators are always accurate.
Reality: Most calculators assume 40 hours × 52 weeks. They don’t account for unpaid time off, overtime, bonuses, or benefits. Your actual earnings could be 10–20% higher or lower than the calculator suggests.
Myth 3: Higher salary always means better life.
Reality: A $65,000 salary in San Francisco provides less purchasing power than $56,000 in Dallas. Location matters more than gross pay for many workers.
Myth 4: $27/hour workers can’t afford homes.
Reality: In much of the Midwest and South, $56,000/year supports homeownership. In coastal cities, it does not. The issue isn’t the wage—it’s the housing market.
Future Outlook: Will $27/Hour Still Be Good in 2030?
Inflation and Wage Growth
If inflation averages 2.5–3% annually, $27/hour in 2026 will need to reach roughly $32–$34/hour by 2030 to maintain the same purchasing power. Wage growth in many sectors is running at 4–5% annually, which suggests $27/hour workers may see their wages rise faster than inflation—but not uniformly across all industries.
Automation Risk
- High risk: Warehouse picking, basic manufacturing, data entry
- Medium risk: Truck driving (autonomous), retail cashiering
- Low risk: Healthcare, skilled trades, complex repair
SalaryInfo Future Prediction: Healthcare and trades will see wage growth above inflation through 2030 due to persistent labor shortages. Logistics and manufacturing will face wage pressure from automation but will still need skilled human workers for oversight and maintenance. Retail and hospitality will likely see slower wage growth.
Policy Changes
The federal minimum wage remains at $7.25. State minimum wages are rising:
- California: $17.00/hour
- New York: $16.50/hour
- Washington: $16.66/hour
- Florida: $14.00/hour
As state minimum wages climb toward $20/hour in some states, $27/hour will increasingly become the new “middle” rather than a standout wage.
What Salary Surveys Don’t Tell You
Most salary data comes from employer-reported surveys or tax records. They miss:
- Overtime: Many hourly workers earn 10–30% above their base rate through overtime
- Shift differentials: Night, weekend, and holiday pay adds $2–$5/hour
- Bonuses: Signing bonuses, retention bonuses, and performance bonuses are increasingly common
- Benefits value: Health insurance, retirement contributions, and PTO add 20–40% to total compensation
- Unpaid time: Unpaid leave, weather closures, and slow seasons reduce actual earnings
SalaryInfo Editorial Verdict: A $27/hour worker with consistent overtime and good benefits may out-earn a $65,000 salaried worker with minimal benefits. The headline number doesn’t tell the full story. When evaluating a job, ask about overtime availability, shift differentials, bonuses, and benefits—not just the hourly rate.
Use our tools to understand your total package:
- CTC Calculator – see your total compensation
- EPF Calculator – understand your retirement savings
- Gratuity Calculator – calculate long-term benefits
- HRA Calculator – maximize housing allowance
People Also Compare
If you’re exploring other hourly rates, here are related salary guides:
| Hourly Rate | Annual Salary (40 hrs/week) |
|---|---|
| $25/hour | $52,000 |
| $26/hour | $54,080 |
| $27/hour | $56,160 |
| $28/hour | $58,240 |
| $29/hour | $60,320 |
| $30/hour | $62,400 |
Also explore: Compare salaries across different career paths:
- Software Engineer Salary – $40–$70/hour
- Data Analyst Salary – $30–$50/hour
- Registered Nurse Salary – $35–$50/hour
- Electrician Salary – $25–$45/hour
- Cyber Security Salary – $40–$65/hour
- Accountant Salary – $25–$45/hour
Frequently Asked Questions
Is $27 an hour a good wage in 2026?
It depends on location. In the Midwest and South, $27/hour ($56,160/year) supports a comfortable middle-class lifestyle. In coastal cities, it’s tight. Nationally, it’s below the median full-time weekly earnings of $1,251 ($65,052/year) and approximately 17% below the average hourly earnings for production and nonsupervisory employees ($32.38/hour in June 2026).
How much is $27 an hour annually after taxes?
For a single filer with no state income tax, take-home is approximately $47,500/year (about $3,960/month). In high-tax states like California or New York, take-home drops to roughly $42,000–$44,000/year ($3,500–$3,700/month). Actual amounts depend on deductions, filing status, and local taxes.
How much is $27 an hour biweekly?
At 40 hours per week, biweekly gross pay is $2,160 ($27 × 80 hours). After federal and FICA taxes, take-home is roughly $1,760 in no-tax states and $1,600–$1,680 in high-tax states.
How much is $27 an hour weekly?
Weekly gross pay is $1,080 ($27 × 40 hours). After taxes, weekly take-home is approximately $880–$920 depending on state taxes and deductions.
How much is $27 an hour monthly?
Monthly gross pay is $4,680 ($56,160 ÷ 12). After taxes, monthly take-home is approximately $3,800–$4,000 in no-tax states and $3,400–$3,700 in high-tax states.
How much is $60,000 a year per hour?
$60,000 per year at 40 hours per week equals $28.85 per hour ($60,000 ÷ 2,080 hours). So $27/hour is about $3,840 less per year than $60,000.
What jobs pay $27 an hour?
Jobs at this rate include surgical technicians, HR assistants, dispatchers, journeyman plumbers, warehouse workers (top earners), and some municipal roles like video specialists. Healthcare, logistics, and skilled trades are the most common sectors.
Is $27 an hour good for a single person?
In most of the US outside major coastal cities, yes. $56,000/year supports a single person comfortably in the Midwest, South, and many Mountain West states. In NYC, LA, or SF, it’s challenging—rent alone consumes 50%+ of take-home pay.
Can you live on $27 an hour?
Yes, but lifestyle depends heavily on location. In low-cost areas, you can rent, own a car, save for retirement, and have disposable income. In high-cost areas, you’ll need roommates, a strict budget, or additional income.
How much is $27 an hour 40 hours a week after taxes?
Approximately $880–$920 per week take-home for a single filer, depending on state taxes. That’s about $45,700–$47,800 per year.
Is $27 an hour middle class?
In most of the US, yes. The median US household income was roughly $80,000 in 2025. A single earner at $56,000 is below that but still in the broad middle class in most regions. In coastal cities, it’s lower-middle class.
What is the LPA equivalent of $56,160?
For readers comparing U.S. salaries with Indian salary packages: $56,160 per year is approximately 5.6 Lakhs Per Annum (LPA) at an exchange rate of 83 INR/USD. See our guides on 4 LPA In-Hand Salary, 5 LPA In-Hand Salary, and 30 LPA In-Hand Salary for more LPA comparisons.