
Pediatrician Salary Snapshot (2026)
| Metric | Amount |
|---|---|
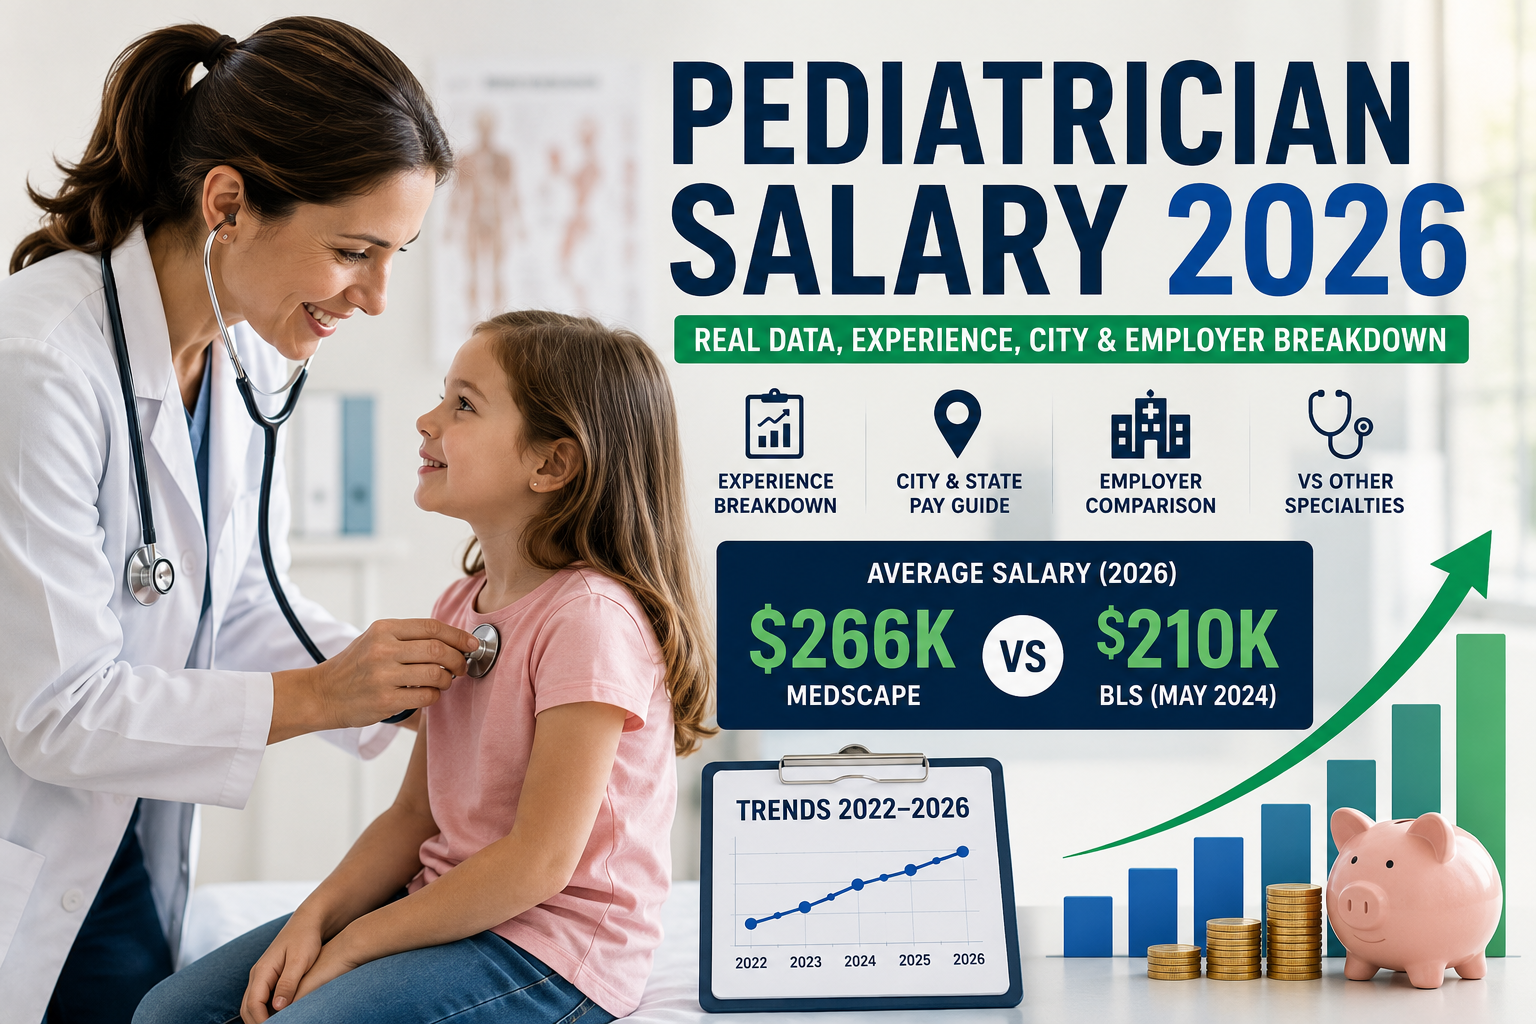
| Average Total Compensation | $266,000 (Medscape) |
| Median Total Compensation | $260,000 (SalaryDr) |
| BLS Median Wage | $210,130 (May 2024) |
| Hourly Rate (Est.) | ~$128 / hour |
| Monthly Pay (Gross) | ~$22,167 |
| Weekly Pay (Gross) | ~$5,115 |
| Top 10% Earners | >$338,000 |
| Bottom 10% Earners | <$91,000 |
The spread between the 10th and 90th percentile is nearly $250,000—a structural chasm, not a simple range.
The Short Answer
A general pediatrician in the United States earns between $210,000 and $266,000 in total annual compensation in 2026, depending on the data source and what is being counted (base salary vs. total package).
However, this headline number is the least useful data point for career planning. The real question is: how much does a pediatrician make with 10 years of experience, in California, working for a private practice, versus a new grad in an academic hospital in the Midwest? That gap exceeds $150,000.
Why the Numbers Don’t Match: A Market Operator’s Perspective
| Source | Figure | What It Actually Measures |
|---|---|---|
| BLS (May 2024) | $210,130 | Median wage across all pediatricians (includes part-time/semi-retired). Backward-looking. |
| Medscape 2026 | $266,000 | Average total compensation (base + bonus + profit-sharing) from physician surveys. |
| SalaryDr 2026 | $260,000 | Median total compensation from 160+ verified physician submissions. |
| Indeed 2026 | ~$215,000 | Average base salary from active job postings (reflects the offer floor). |
| ZipRecruiter 2026 | $192,507 | Average base salary from a wider, less curated set of job listings. |
Market interpretation: Job boards show you what employers hope to pay. Physician surveys show you what doctors actually take home. If you are negotiating, the survey numbers are your anchor. The job-ad numbers are the employer’s starting position.
Salary Growth Timeline: 2022–2026
| Year | Average Total Compensation (Est.) | Year-over-Year Change |
|---|---|---|
| 2022 | ~$228,000 | +2.8% |
| 2023 | ~$235,000 | +3.1% |
| 2024 | ~$245,000 | +4.3% (post-COVID catch-up) |
| 2025 | ~$252,000 | +2.9% |
| 2026 | ~$266,000 | +5.5% (current survey data) |
What this trend reveals: Pediatrician compensation grew slightly above the general physician average in 2024 and 2026 but has largely kept pace with inflation. The 5.5% jump in 2026 is notable but reflects a rebasing of survey data (more complete bonus reporting) rather than a structural market shift. Do not expect 5%+ annual growth to continue.
The Real Money Variables: Subspecialty, Setting, and Shift
1. Subspecialty: The Fellowship Premium
| Pediatric Specialty | Median Total Comp | Premium vs. General |
|---|---|---|
| General Pediatrics | $260,000 | — |
| Pediatric Cardiology | $425,000 | +63% |
| Pediatric Surgery | $410,000 | +58% |
| Neonatology | $400,000 | +54% |
| Pediatric Emergency Med | $355,000 | +37% |
| Pediatric Gastroenterology | $350,000 | +35% |
| Pediatric Pulmonology | $310,000 | +19% |
| Developmental Pediatrics | $270,000 | +4% |
Analysis: Procedural pediatric subspecialties (cardiology, surgery, neonatology) generally provide a substantially higher financial return than non-procedural fellowships. Developmental pediatrics, at only a 4% premium for three extra years of training, presents a weak financial ROI relative to the opportunity cost.
2. Practice Setting: The PSLF Trade-Off
| Setting | Median Comp | PSLF Eligible | Benefits Quality |
|---|---|---|---|
| Private Pediatrics Practice | $290,000 | No | Varies |
| Multi-Specialty Group | $275,000 | Rarely | Good |
| Hospital-Employed | $260,000 | Often yes | Good-Excellent |
| Academic/Children’s Hospital | $245,000 | Usually yes | Excellent |
The loan forgiveness equation: For a pediatrician with $250,000–$300,000 in student loans, Public Service Loan Forgiveness (PSLF) can eliminate $150,000–$300,000+ tax-free after 120 qualifying payments. That is equivalent to an additional $15,000–$30,000 per year over a decade—enough to close the private practice premium entirely.
3. Hospitalist vs. Outpatient
- Outpatient General Pediatrics: ~$250,000. Standard weekday hours, limited call, lower acuity.
- Pediatric Hospitalist: ~$295,000. Shift-based (including nights/weekends), higher acuity, procedural work (lumbar punctures, intubations).
The $45,000 premium is compensation for schedule disruption and clinical intensity.
Geographic Compensation: State + City Breakdown
Highest Paying States
| State | BLS Median | Est. After-Tax Income (Single) | Job Density |
|---|---|---|---|
| Louisiana | $354,060 | ~$339,000 | Very Low |
| Alaska | $284,210 | ~$284,000 | Very Low |
| California | $283,620 | ~$257,500 | Very High |
| Mississippi | $281,750 | — | Low |
| Iowa | $257,430 | ~$247,600 | Moderate |
Reality check: Louisiana pays a premium because it is underserved and has a high Medicaid population. California pays well but taxes heavily. The highest take-home pay often lies in no-income-tax states with moderate costs, but those states rarely have large job markets.
Highest Paying Cities
| City | Average Annual Salary |
|---|---|
| Vallejo, CA | $319,800 |
| San Francisco, CA | $319,060 |
| Davenport, IA | $309,520 |
| Des Moines, IA | $292,250 |
| Manchester, NH | $291,180 |
| Sacramento, CA | ~$252,800 |
| New York, NY | ~$233,300 |
| Los Angeles, CA | ~$228,500 |
| Seattle, WA | ~$240,000 (est.) |
| Chicago, IL | ~$230,000 (est.) |
| Houston, TX | ~$200,000 (est.) |
City-level premiums often reflect a combination of cost of living, local competition, and the presence of major children’s hospitals.
Salary by Experience Level
| Experience Level | Estimated Total Compensation |
|---|---|
| Resident (PGY-1 to PGY-3) | ~$60,000–$68,000 (stipend) |
| 0–2 Years (Post-Residency) | ~$190,000–$205,000 |
| 3–5 Years | ~$220,000–$240,000 |
| 6–10 Years | ~$260,000–$275,000 |
| 10–20 Years | ~$280,000–$300,000 |
| 20+ Years | ~$290,000–$315,000 |
Key observation: The steepest growth occurs between years 3 and 10 as productivity bonuses ramp up and partnership tracks (in private practice) mature. After 20 years, income often plateaus unless the physician takes on administrative leadership roles.
Salary by Employer Type
| Employer Type | Median Total Comp | Notes |
|---|---|---|
| Private Practice (Partner) | $290,000–$320,000 | High upside, but buy-in costs and overhead risks. |
| Private Practice (Associate) | $220,000–$240,000 | Lower starting pay, productivity-based path to partnership. |
| Multi-Specialty Physician Group | $275,000 | Steady, less volatility than private practice. |
| Hospital/Health System Employee | $260,000 | Good benefits, typically PSLF-eligible. |
| Kaiser Permanente / Managed Care | ~$270,000 | Salaried with good benefits, no billing overhead. |
| Academic / Children’s Hospital | $245,000 | Lower pay, higher prestige, PSLF-eligible, strong research support. |
| VA Hospital / Military | ~$220,000–$240,000 | Federal benefits and pension, PSLF-eligible. |
Employer-specific takeaway: The highest-paying employers (per Indeed data) include Rhino Medical ($499,200) and SSM Health ($496,000)—but these are typically locum tenens or highly productivity-weighted roles, not standard W-2 positions.
Pediatrician vs. Other Specialties (2026)
| Specialty | Average/Median Compensation |
|---|---|
| Pediatrician | $266,000 |
| Family Medicine | ~$255,000 |
| Internal Medicine | ~$285,000 |
| Psychiatry | ~$305,000 |
| OB/GYN | ~$330,000 |
| Emergency Medicine | ~$380,000 |
| Radiology | ~$420,000 |
| General Surgery | ~$400,000 |
| Hospitalist (Adult) | ~$320,000 |
The relative position: Pediatrics sits at the bottom of the physician compensation ladder, even below the primary care average ($298,000). This is a structural function of the specialty’s payor mix and procedure mix, not a reflection of workload or training rigor.
Gender Pay Gap: The Persistent Institutional Issue
Women represent 65% of practicing pediatricians and 70% of graduating residents. Yet:
- Starting salaries for women are a median of $10,000 lower than men.
- After 10 years, the gap widens to nearly $20,000.
- This gap persists after adjusting for productivity, hours, sub-specialty, and geography.
The American Academy of Pediatrics has officially called for gender pay equity. From a market efficiency standpoint, this gap suggests structural compensation biases rather than pure economic performance differentials.
2026 Outlook: Flat Is the New Up
- Only 45% of pediatricians feel fairly compensated.
- 33% expect pay increases in the coming year.
- 47% expect flat pay.
- 19% expect a decrease.
The macro headwinds include stagnant Medicaid reimbursement rates and a reimbursement model that penalizes preventive care relative to procedural care. Pediatrics is not a growth market for compensation.
How Fast Can You Become a Pediatrician?
Minimum total training: 11 years post-high school.
- 4 years undergraduate
- 4 years medical school
- 3 years pediatric residency
Fellowship (subspecialty): +2 to +3 years.
Financial ROI consideration: The 11-year training pipeline is standard for primary care. However, the $260,000 median makes the per-hour training ROI lower than nearly all other specialties. PSLF is the primary tool to offset this.
Frequently Asked Questions
What is the average pediatrician salary in the US in 2026?
The average ranges from $210,130 (BLS median) to $266,000 (Medscape average total compensation). The variation reflects different data sources and inclusion criteria (base salary vs. total compensation).
What is the highest-paid type of pediatrician?
Pediatric cardiologists earn approximately $425,000, followed by pediatric surgeons ($410,000) and neonatologists ($400,000). Interventional cardiology offers the strongest lifetime earnings trajectory.
How much do pediatricians make per month in 2026?
Based on a $266,000 annual average, gross monthly compensation is approximately $22,167. After federal, state, and FICA taxes, take-home pay ranges from roughly $15,500/month (high-tax states) to over $19,000/month (no-tax states).
How fast can you become a pediatrician?
The minimum pathway is 11 years post-high school: 4 years undergraduate, 4 years medical school, and 3 years of pediatric residency. Subspecialists require 2–3 additional years.
Do pediatric hospitalists earn more than outpatient pediatricians?
Yes. Pediatric hospitalists earn roughly $295,000 compared to $250,000 for outpatient general pediatricians—a premium of $45,000 that reflects shift work and higher acuity.
Which state pays pediatricians the most?
Louisiana pays the highest nominal wage at $354,060, followed by Alaska ($284,210) and California ($283,620). However, after-tax income varies significantly, with Louisiana’s take-home exceeding California’s by ~$82,000.
Is PSLF worth it for pediatricians?
Yes. For a pediatrician with $250,000–$300,000 in student loans, PSLF can forgive $150,000–$300,000+ tax-free after 10 years, effectively adding $15,000–$30,000 per year in value.
Calculate Your Take-Home Salary
Gross compensation numbers are only half the picture. Your actual in-hand salary depends on federal tax brackets, state income tax, FICA, health insurance premiums, and retirement contributions.
Use our free tools to estimate your real net income:
- Income Tax Calculator – Estimate federal + state tax liability.
- CTC Calculator – Break down your cost-to-company vs. take-home.
- HRA Calculator – Maximize house rent allowance exemptions.
- Salary Slip Generator – Understand each component of your paycheck.
- EPF Calculator & Gratuity Calculator – Plan your long-term savings.
For broader salary benchmarks, explore our Knowledge Center or compare roles in Private Sector and Government Sector .
Key Takeaways
1. The number you see depends on what is counted. Base salary from job ads (~$215,000) is *not* total compensation (~$266,000). Know the distinction.
2. Subspecialty remains the strongest lever. Procedural fellowships (cardiology, surgery, neonatology) yield 35–63% premiums over general pediatrics. Developmental pediatrics offers a poor ROI for the additional training years.
3. Geography is about trade-offs. Louisiana pays the highest nominal amount, but it is an underserved market with few jobs. California pays well but takes a significant tax bite. Focus on take-home pay and job density.
4. PSLF reshapes the economics of practice setting. A $245,000 academic job with PSLF may produce higher net lifetime wealth than a $290,000 private practice job without it.
5. Experience drives a steep curve. Expect a ~$70,000+ jump from years 0–10. After year 20, income plateaus unless you move into administration.
6. Employer choice matters. Private practice partners earn the most, but hospital employment offers stability and PSLF. Locums firms can pay over $400,000 in certain high-need assignments.
7. Pediatrics remains the lowest-paid major specialty. This is a structural reality. Factor loan forgiveness, lifestyle preferences, and non-monetary rewards into your decision.
Editorial & Data Methodology
Editorial Process: This analysis integrates data from the Bureau of Labor Statistics (OEWS survey), Medscape Physician Compensation Report 2026, SalaryDr verified physician submissions, and Indeed/ZipRecruiter job posting aggregates. All interpretations and market commentary are based on comparative quantitative analysis and historical trending.
Data Sources: BLS Occupational Employment and Wage Statistics (May 2024); Medscape Pediatrician Compensation Report 2026; SalaryDr Pediatrics Database (160+ submissions); AAP salary survey references.
Last Reviewed: July 22, 2026.
Update Frequency: Annual (post-survey release) with interim adjustments for inflation and reported contract changes.
Explore more physician compensation data: Pediatric Surgeon Salary, Neurosurgeon Salary, Cardiologist Salary, Surgeon Salary, Radiologist Salary, Anesthesiologist Salary, Obstetrician Salary, Ophthalmologist Salary, Plastic Surgeon Salary, Urologist Salary, Psychologist Salary.