
Cardiothoracic Surgeon Compensation Analysis | SalaryInfo USA
Methodology & Editorial Standards
SalaryInfo USA evaluates physician compensation using a multi-source approach. This analysis draws from:
- Verified physician salary submissions (2025–2026)
- Society of Thoracic Surgeons (STS) compensation surveys
- MGMA physician compensation benchmarks
- Real-time job postings from major healthcare employers and professional associations
- Public compensation disclosures from academic medical centers and health systems
What “Total Compensation” Includes: Throughout this report, total compensation refers to base salary plus bonuses, incentive pay, call pay, quality bonuses, and other cash compensation. It does not include benefits, retirement contributions, or non-cash perks unless explicitly noted.
Salary Range Compilation: Percentile data and ranges are derived from verified submissions and survey data. Averages are calculated using standard statistical methods, excluding outliers to prevent distortion.
Editorial Review: This report has been reviewed by the SalaryInfo editorial team using the sources above. Figures represent 2026 compensation data for the United States unless otherwise noted.
The $1.2 Million Question
What’s the single biggest mistake most heart surgeons make when evaluating a job offer?
They fixate on the base salary.
The numbers that actually matter—productivity bonuses, call pay, wRVU rates, and partnership tracks—often get buried in the fine print. A $900,000 offer with a clear path to $1.4 million in three years may ultimately deliver more lifetime earnings than a $1.1 million offer with a capped ceiling. Yet many surgeons don’t discover this until year two, when they realise their colleague down the hall is taking home significantly more for the same caseload.
Here’s what the 2026 market actually looks like.
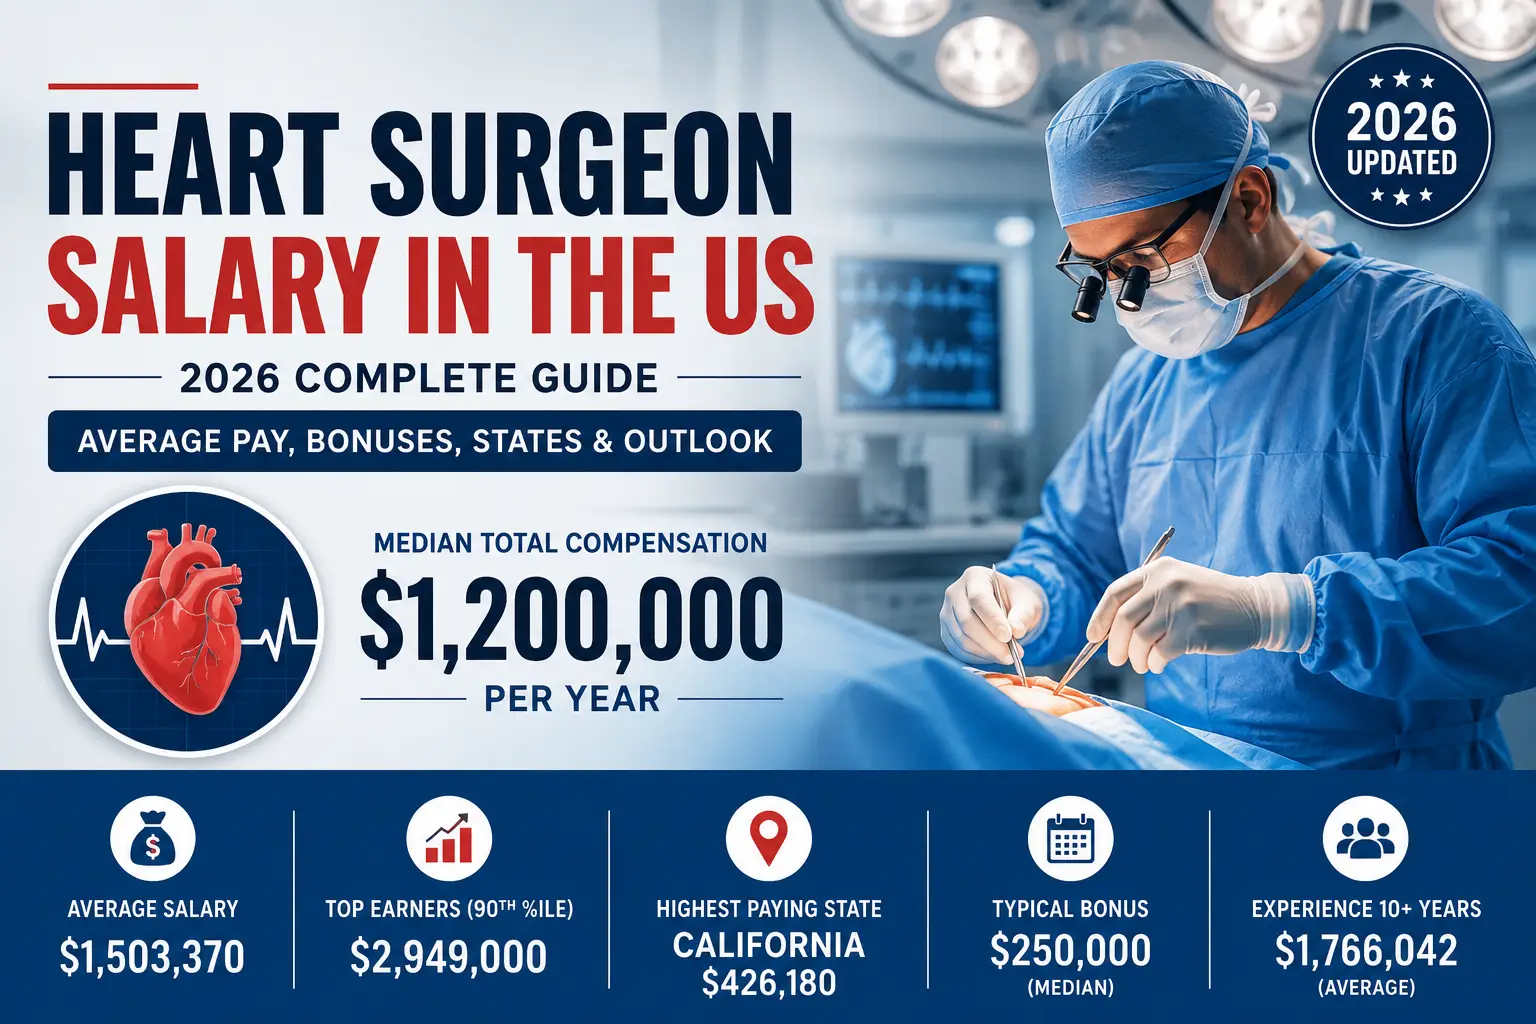
The median cardiothoracic surgeon in the United States earns $1,200,000 annually, according to verified physician submissions. But that number tells you almost nothing about what you should earn. The real story is in the spread: the 25th percentile sits at $1,000,000, the 75th at $1,300,000, and the 90th percentile reaches $2,949,000. That’s a substantial gap between the lower end and the top performers.
SalaryInfo Insight: The data suggests that top earners tend to understand their wRVU production, know their market value across regions, and negotiate multiple components of their compensation package. Base salary is only one part of the equation.
Why This Market Is Different From What You’ve Read
Here’s a problem: look up “heart surgeon salary” on most websites and you’ll find numbers that range from $367,000 to $1.25 million. That’s not a range. That’s confusion.
What explains the discrepancy?
Most salary aggregators scrape job postings, not actual earnings. A job posting might list a $400,000 base—but the surgeon in that role may earn another $600,000 in productivity bonuses, call pay, and quality incentives. The posting rarely shows the total package. Peer-reported data typically captures the full picture.
Here’s what the actual compensation landscape looks like in 2026:
| Metric | Value |
|---|---|
| Median Total Compensation | $1,200,000 |
| Average Total Compensation | $1,503,370 |
| 25th Percentile | $1,000,000 |
| 75th Percentile | $1,300,000 |
| 10th Percentile | $500,000 |
| 90th Percentile | $2,949,000 |
Salary Distribution at a Glance
| Percentile | Compensation |
|---|---|
| 10th | $500,000 |
| 25th | $1,000,000 |
| 50th (Median) | $1,200,000 |
| 75th | $1,300,000 |
| 90th | $2,949,000 |
| Practice Type | Typical Total Compensation Range |
|---|---|
| Hospital Employed | $500,000 – $1,300,000 |
| Private Practice / Partnership | $700,000 – $1,200,000+ |
| Academic | $455,000 – $1,164,900 |
| High-Volume Private | $1,200,000 – $2,949,000+ |
SalaryInfo Observation: The academic vs. private gap reflects differences in case mix, autonomy, and career trajectory. Academic positions offer research opportunities and institutional prestige but typically cap compensation lower. Private practice offers higher earnings potential but comes with business risk and administrative responsibility. Surgeons in academic settings often trade higher pay for research opportunities, which may be the right choice depending on individual career goals.
How This Compares to Other Medical Specialties
To understand whether cardiothoracic surgery offers competitive compensation, it helps to see how it stacks up against other high-earning medical careers.
| Specialty | Median Annual Compensation |
|---|---|
| Cardiothoracic Surgeon | $1,200,000 |
| Neurosurgeon | $875,000 – $1,200,000 |
| Plastic Surgeon | $700,000 – $950,000 |
| Cardiologist | $600,000 – $850,000 |
| Urologist | $500,000 – $750,000 |
| Anesthesiologist | $450,000 – $650,000 |
| Obstetrician/Gynecologist | $350,000 – $550,000 |
| Ophthalmologist | $400,000 – $600,000 |
| Pediatric Surgeon | $400,000 – $600,000 |
| Pathologist | $300,000 – $500,000 |
| Pediatrician | $200,000 – $300,000 |
Cardiothoracic surgery consistently ranks among the highest-compensated medical specialties—often surpassing neurosurgeons and plastic surgeons at the median. However, the trade-off is significant: longer training, heavier call burdens, and higher malpractice risk.
For context, here’s how physician salaries compare to other healthcare roles:
| Role | Median Annual Compensation |
|---|---|
| Cardiothoracic Surgeon | $1,200,000 |
| CRNA (Certified Registered Nurse Anesthetist) | $200,000 – $250,000 |
| Nurse Practitioner | $120,000 – $160,000 |
| Registered Nurse | $80,000 – $100,000 |
| Radiology Tech | $65,000 – $85,000 |
| Medical Assistant | $40,000 – $50,000 |
SalaryInfo Career Strategy: The hierarchy matters for career planning. If you’re considering medical school, understanding that cardiothoracic surgery offers the highest ceiling—but requires the longest training—helps you make an informed decision about whether the investment aligns with your goals.
Where Heart Surgeons Earn the Most
Location is a significant driver of compensation after productivity. But the relationship isn’t as simple as “California pays more.”
In fact, after accounting for taxes, a surgeon earning $1.2 million may keep substantially more in no-income-tax states compared to high-tax states.
| State | Gross Salary | Estimated Effective Tax Rate | Estimated Take-Home Pay | Estimated Difference vs. CA |
|---|---|---|---|---|
| Alaska | $1,200,000 | 36.1% | $766,363 | +$110,400 |
| Florida | $1,200,000 | 36.1% | $766,363 | +$110,400 |
| Nevada | $1,200,000 | 36.1% | $766,363 | +$110,400 |
| New Hampshire | $1,200,000 | 36.1% | $766,363 | +$110,400 |
| South Dakota | $1,200,000 | 36.1% | $766,363 | +$110,400 |
| California | $1,200,000 | 45.3% | $655,963 | — |
| Oregon | $1,200,000 | 45.1% | $658,363 | −$108,000 |
| Hawaii | $1,200,000 | 44.9% | $660,763 | −$105,600 |
| Minnesota | $1,200,000 | 44.3% | $667,963 | −$98,400 |
Important Note on Tax Estimates: These figures are illustrative estimates based on simplified assumptions about effective tax rates. Actual tax liability depends on filing status, deductions, retirement contributions, state and local tax laws, and other individual factors. Consult a tax professional for personalized advice.
The takeaway: Gross salary numbers can be misleading. A $1.1 million offer in Texas (no state income tax) may leave you with more take-home pay than a $1.3 million offer in California. Understanding the difference between CTC and in-hand salary is critical when comparing offers across states.
Real-world job postings show geographic variation:
| Location | Salary Range | Source |
|---|---|---|
| Fall River, MA | $790,000 – $1,005,000 | STS Career Center |
| Albany, NY | $950,000 – $975,000 | AHA Job Board |
| Fresno, CA | Starting at $800,000 | Heart Failure Society |
| Cooperstown, NY | $780,000 – $900,000 | Bassett Healthcare |
| Aurora, CO | $850,000 – $950,000 | ASSH Job Board |
| Sacramento, CA (Academic) | $455,024 – $1,164,900 | UC Davis Health |
| Des Moines, IA | Up to $850,000 | Trinity Health |
Why Experience Changes Everything
A first-year attending and a 15-year veteran aren’t playing the same game.
Data shows early-career surgeons (0-5 years) earn a median of $878,000, while mid-career surgeons (6-15 years) earn $1,175,000—a 34% increase. Senior attendings (16+ years) reach $1,200,000.
| Career Stage | Median Compensation | Growth vs. Previous Stage |
|---|---|---|
| Early Career (0-5 years) | $878,000 | — |
| Mid-Career (6-15 years) | $1,175,000 | +34% |
| Senior Attending (16+ years) | $1,200,000 | +2% |
However, the data suggests that productivity—not just time—drives earnings. Surgeons who perform high-volume, high-complexity cases typically out-earn their peers regardless of years in practice.
Recent survey data reveals that surgeons within two years of training saw median total compensation grow 18.3% (cardiac), 7.7% (general thoracic), and 20.9% (hybrid) year-over-year. This suggests early-career surgeons may be catching up faster than in previous generations.
The Compensation Components Most Surgeons Overlook
Base salary accounts for about 86% of total compensation for cardiothoracic surgeons—roughly $1,296,957. The remaining 14% comes from bonuses, profit sharing, and incentives.
74% of cardiothoracic surgeons report receiving bonus or incentive pay. However, bonus structures vary significantly by employer and compensation model.
| Bonus Metric | Value |
|---|---|
| Median Bonus | $250,000 |
| Average Bonus | $268,676 |
| 25th Percentile | $150,000 |
| 75th Percentile | $350,000 |
| Bonus as % of Total Comp | 15% |
Key Takeaway: Bonus structures differ widely. Some practices offer lower bonuses but higher guaranteed salaries. Others emphasise productivity-based incentives. The data suggests that surgeons in the top quarter earn $350,000 or more in incentives, but this reflects specific compensation models rather than universal expectations.
What typically drives bonus potential:
- wRVU production: The median cardiothoracic surgeon generates approximately 11,396 wRVUs annually at roughly $58 per wRVU. Complex procedures like CABG (33.75 wRVU) and other complex cases exceeding 40 wRVU per procedure mean productive surgeons can far exceed these benchmarks.
- Call coverage: 22% of surgeons take call, with 44% receiving call pay averaging $2,076 per day.
- Quality and productivity bonuses: These can add $144,000+ annually in some practices.
When evaluating your total compensation, use an overtime calculator and income tax calculator to understand your true take-home pay. Many surgeons underestimate how much call pay and bonuses contribute to their annual earnings.
The Training Investment: What It Really Costs
Becoming a heart surgeon requires:
- 4 years of medical school
- 3-5 years of general surgery residency
- 2-3 years of cardiothoracic surgery fellowship
Total training: 7-8 years after undergraduate education.
The financial reality:
- Median medical school debt: $200,000
- Average resident salary: $75,000/year
- Break-even point: Approximately 1 year as an attending
SalaryInfo Career Strategy: The break-even calculation assumes you maintain a resident’s lifestyle for one year after starting as an attending. Most surgeons don’t do this—and that’s fine. But understanding the math helps you make informed decisions about loan repayment vs. investment vs. lifestyle inflation.
Use the gratuity calculator and EPF calculator to understand how retirement benefits factor into your long-term compensation—although for most private practice surgeons, retirement planning looks different than for employed physicians.
Specialty Sub-Divisions: Cardiac vs. Thoracic
Not all heart surgeons earn the same.
| Subspecialty | Median Compensation |
|---|---|
| Cardiac Cardiothoracic | $1,250,000 |
| General Cardiothoracic | $1,200,000 |
| Thoracic (non-cardiac) | ~$837,000 |
Cardiac-focused surgeons out-earn general thoracic surgeons by nearly $400,000 annually. The gap reflects procedure complexity, RVU values, and case volume.
Pediatric cardiac surgery typically earns significantly less, with median compensation around $674,000—roughly half of adult cardiac surgery. The trade-off often includes more predictable hours, academic affiliation, and the intangible reward of treating children.
Congenital heart surgeons face unique challenges: longer training, lower case volumes, and reimbursement that doesn’t fully reflect the complexity of the work. Recent surveys found congenital surgeons had the lowest compensation satisfaction scores of any subspecialty.
What Employers Actually Value
One of the most overlooked factors in heart surgeon compensation is case volume and complexity.
A surgeon who performs 200+ cardiac cases annually—including complex valve repairs, aortic dissections, and TAVR procedures—typically generates more revenue than a surgeon performing 100 cases. Employers structure compensation to reflect this.
What typically drives employer compensation decisions:
| Factor | Typical Impact on Compensation |
|---|---|
| Case volume (annual) | High—more cases typically mean more revenue |
| Case complexity | High—complex cases typically generate higher wRVUs |
| Call coverage | Moderate—$2,000+/day can add up |
| Administrative roles | Variable—leadership positions may add 5-15% |
| Research / Academic output | Low-Moderate—adds prestige value, not direct revenue |
| Geographic need | High—hard-to-fill locations often pay premiums |
The key takeaway for surgeons entering contract negotiation is knowing their worth and their options. Salary is only one of many issues that can be negotiated.
The Future Outlook: 2026-2031
Demand for cardiothoracic surgeons appears strong based on available data.
A widely cited analysis projected a deficit of 2,000 cardiothoracic surgeons by 2030. The 2025 thoracic surgery match achieved a 100% fill rate for the first time, with the integrated I-6 pathway expanding from 3 positions in 2007 to 48 positions in 2025—applications increased by 150%.
Important Note on Future Projections: These figures represent established projections based on current data. Actual future demand may vary depending on healthcare policy changes, technological advances, and economic conditions.
What this suggests for the profession:
- Job security: High demand may support stable career prospects
- Negotiating power: Labour shortages may give surgeons leverage
- Potential compression risk: More trainees entering the field could eventually moderate salary growth
- Geographic variation: Rural and underserved areas may continue to offer premium compensation
SalaryInfo Market View: The projected shortage is not uniform across all regions. Major metropolitan areas with multiple training programmes face more competition. Rural and mid-sized markets—think Des Moines, Fresno, or Cooperstown—may offer higher compensation relative to cost of living.
What Salary Surveys Don’t Tell You
Most compensation reports give you averages. Here’s what they often leave out:
The gender pay gap persists. A study of academic cardiothoracic surgeons found Black or African American faculty earned 59% to 94% of the median salary earned by White faculty. Hispanic or Latino faculty earned 84% to 165% of the median.
Compensation transparency is still poor. The survey found that when asked how clearly employers communicated compensation structures (1-5 scale), the average score was just 3.33. Employers consistently providing benchmarking data scored even lower at 2.32.
Satisfaction isn’t just about money. For the first time, recent surveys asked surgeons to rank non-monetary job features that carry similar weight to salary—including schedule flexibility, administrative support, and mentorship.
SalaryInfo Career Strategy: When evaluating an offer, don’t stop at the compensation number. Ask about:
- How productivity is measured and rewarded
- What the wRVU targets are and whether they’re achievable
- How call schedules are structured and compensated
- What the partnership or equity track looks like (if applicable)
- What non-clinical time is available for administrative or academic work
The Salary Ceiling Most Surgeons Never Reach
The 90th percentile earns $2,949,000. The median is $1,200,000. That’s a significant gap.
Several factors appear to differentiate top earners:
1. Private practice ownership. Surgeons who own their practice or have equity in a surgical centre may capture facility fees and ancillary revenue streams that employed surgeons typically don’t see.
2. High-volume, high-complexity practices. The surgeons earning $2M+ typically perform 300+ cases annually, including complex reoperations, aortic arch procedures, and structural heart interventions.
3. Geographic arbitrage. Operating in a high-demand, low-competition market may allow surgeons to command premium rates.
4. Multiple revenue streams. Beyond clinical work, some top earners generate income from teaching, speaking, consulting, and medical device royalties.
SalaryInfo Verdict: The ceiling is real, but it’s not for everyone. Private practice ownership requires business acumen and risk tolerance. High-volume practices demand exceptional stamina and efficiency. Geographic arbitrage often means living where most people don’t want to live.
Career Risks Worth Understanding
No discussion of heart surgeon compensation is complete without acknowledging the risks.
Reimbursement pressure. Medicare and commercial payers continue to scrutinise cardiovascular procedure reimbursement. While demand remains strong, reimbursement per procedure has not kept pace with inflation in some areas.
Technology disruption. AI and robot-assisted platforms are increasingly influencing cardiothoracic surgery—enhancing risk prediction, imaging interpretation, and minimally invasive access. To date, these technologies have augmented rather than replaced surgeons, but the long-term impact on case volume and compensation remains uncertain.
Lifestyle costs. Cardiothoracic surgery carries one of the heaviest call burdens in medicine. Work-life balance scores are consistently low—career intelligence data rates cardiothoracic surgery at 0/100 for work-life balance. The trade-off for high compensation is significant personal sacrifice.
Malpractice risk. While specific malpractice costs vary by state and practice setting, cardiothoracic surgeons face among the highest malpractice premiums in medicine.
How to Generate Your Salary Slip and Understand Your Pay Structure
For employed cardiothoracic surgeons, understanding your compensation breakdown is essential. Your salary slip should clearly show:
- Base salary (your guaranteed annual pay)
- Productivity bonus (based on wRVUs or case volume)
- Quality bonus (based on outcomes and metrics)
- Call pay (compensation for on-call coverage)
- Other income (teaching stipends, administrative roles, leadership bonuses)
Many surgeons receive a CTC (Cost to Company) breakdown that includes benefits like health insurance, retirement contributions, and CME allowances. Understanding the difference between CTC and in-hand salary helps you evaluate total compensation accurately.
A salary slip generator can help you visualise your compensation structure, but for employed physicians, the key is ensuring your contract clearly defines each component. Vague language about “performance-based bonuses” without defined metrics is a red flag.
Featured Snippets: Quick Answers
How much does a heart surgeon make in the United States?
The median cardiothoracic surgeon salary in the United States is $1,200,000 per year as of August 2026, based on verified physician submissions. Total compensation ranges from $500,000 at the 10th percentile to $2,949,000 at the 90th percentile, with most earning between $1,000,000 and $1,300,000.
How many years does it take to become a heart surgeon?
Becoming a cardiothoracic surgeon requires 7-8 years of training after medical school: 3-5 years of general surgery residency followed by 2-3 years of cardiothoracic surgery fellowship. Including medical school, total post-undergraduate training is approximately 11-12 years.
What is the highest salary for a heart surgeon?
The top 10% of cardiothoracic surgeons earn $2,949,000 or more annually. The highest reported salaries exceed $5 million for surgeons in high-volume private practice with ownership stakes in surgical facilities.
Do heart surgeons earn more in California?
Gross salaries in California are higher, but after estimated taxes, a surgeon earning $1.2 million may keep approximately $110,400 less per year in California than in no-income-tax states like Florida or Texas. The estimated effective tax rate is 45.3% in California versus 36.1% in tax-free states.
What is the starting salary for a heart surgeon?
Entry-level cardiothoracic surgeons (0-5 years experience) earn a median of $878,000 annually. Starting salaries for new graduates typically range from $400,000 to $650,000 in academic settings and $500,000 to $800,000 in hospital-employed or private practice positions.
Frequently Asked Questions
Is cardiothoracic surgery a good career in 2026?
Based on verified physician data, cardiothoracic surgery scores 76/100 on career intelligence scales—with perfect 100/100 scores for salary satisfaction and “would choose again” rates, but a 0/100 for work-life balance. 91% of cardiothoracic surgeons say they would choose this specialty again. The career offers exceptional compensation and intellectual satisfaction but demands significant personal sacrifice.
How much do top heart surgeons make?
The 90th percentile earns $2,949,000 annually, with some top performers exceeding $5 million. These surgeons typically work in high-volume private practices, own equity in surgical facilities, or have multiple revenue streams including consulting and device royalties.
What is the average heart surgeon salary in California?
Job postings in California show ranges from $455,024 (academic) to $1,164,900, with hospital-employed positions starting at $750,000-$800,000. However, California’s high state income tax (estimated effective rate 45.3% on $1.2M) may significantly reduce take-home pay compared to no-tax states.
How much does a heart surgeon earn per hour?
Based on a median salary of $1,200,000 and an average 72-hour work week, a cardiothoracic surgeon earns approximately $577 per hour. This translates to roughly $100,000 per month.
What is the difference between a cardiac surgeon and a cardiothoracic surgeon?
Cardiac surgeons focus specifically on the heart and great vessels. Cardiothoracic surgeons operate on the heart, lungs, esophagus, and other thoracic structures. Cardiac surgeons typically earn a premium—median $1,250,000 vs. $1,200,000 for general cardiothoracic surgeons.
Do heart surgeons get bonuses?
Yes—74% of cardiothoracic surgeons report receiving bonus or incentive compensation. The median bonus is $250,000, with the top quarter earning $350,000 or more in incentives. Bonuses typically represent about 15% of total compensation, though this varies significantly by practice setting.
What is the job outlook for heart surgeons?
The outlook appears positive, with a projected deficit of 2,000 cardiothoracic surgeons by 2030. The 2025 thoracic surgery match achieved a 100% fill rate, and applications to integrated training pathways increased by 150%. Demand is expected to remain strong through 2030 and beyond, though actual outcomes may vary.
How does experience affect heart surgeon salary?
Early-career surgeons (0-5 years) earn a median of $878,000. Mid-career surgeons (6-15 years) earn $1,175,000—a 34% increase. Senior attendings (16+ years) earn $1,200,000. The most significant growth occurs in the first 6-15 years of practice.
What do heart surgeons earn in academic vs. private practice?
Academic positions range from $455,000 to $1,164,900. Hospital-employed surgeons typically earn $500,000 to $1,300,000. Private practice surgeons with partnership can earn $700,000 to over $2.9 million.
How do I negotiate a heart surgeon salary?
Industry experts emphasise that surgeons must know their worth and options. Key negotiation points include: base salary, productivity bonuses, wRVU targets, call compensation, partnership track, signing bonus, relocation assistance, CME allowance, and non-compete clauses. Comprehensive compensation data provides benchmarking leverage.
Publication Metadata
Last Updated: August 5, 2026
Reviewed By: SalaryInfo Editorial Team
Data Sources: Verified physician submissions, Society of Thoracic Surgeons Compensation Survey, MGMA benchmarks, AAMC data
Review Date: August 5, 2026
SalaryInfo Quality Score
Data sources: Verified physician submissions, Society of Thoracic Surgeons Compensation Survey, MGMA benchmarks, AAMC data, and real-time job postings from STS Career Center, AHA Professional Heart Daily, and NEJM Career Center. All salary figures represent 2026 compensation data for the United States.